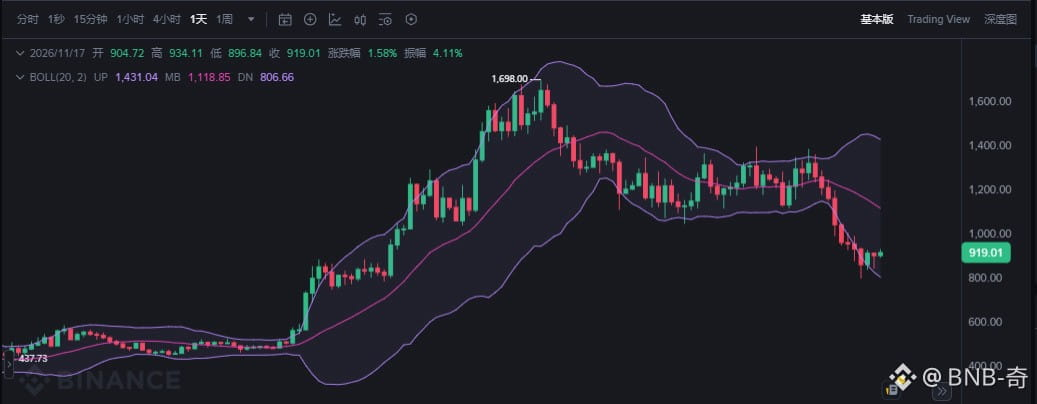
$ZEC The current price is around $919, and the trend remains bearish. It has continued to decline from the September high of about $1,698 and is currently fluctuating around $900, after hitting a low near $801
Technical picture: The daily RSI has rebounded from a low of 29 to the 33–35 range, suggesting potential for a short-term recovery. However, the price remains well below the 20-day and 50-day moving averages, while the MACD and overall structure remain bearish. The trend has not changed
Fund flows are the key constraint. Grayscale's spot ZEC ETF continues to see net outflows, totaling tens of millions of dollars in November. Recent daily outflows have still been around $9 million
The current rebound is driven more by short covering and a temporary recovery caused by short-term liquidation pressure than by new buyers actively entering the market. Trading volume has also not increased significantly, leaving the rebound on shaky ground
Key levels to watch: $1,000 is a psychological and structural resistance level. If the price cannot reclaim it, bears are likely to remain in control in the short term
The $860–$845 area is a zone of concentrated long liquidations and support at recent lows. If it breaks, the medium-term target is around $740. In principle, oversold conditions can trigger a technical rebound, but while ETF outflows continue and the price fails to decisively reclaim $1,000, any rebound is likely to be only a weak recovery
Only a high-volume hold above $1,000 could signal a substantial trend reversal$ZEC
Technical picture: The daily RSI has rebounded from a low of 29 to the 33–35 range, suggesting potential for a short-term recovery. However, the price remains well below the 20-day and 50-day moving averages, while the MACD and overall structure remain bearish. The trend has not changed
Fund flows are the key constraint. Grayscale's spot ZEC ETF continues to see net outflows, totaling tens of millions of dollars in November. Recent daily outflows have still been around $9 million
The current rebound is driven more by short covering and a temporary recovery caused by short-term liquidation pressure than by new buyers actively entering the market. Trading volume has also not increased significantly, leaving the rebound on shaky ground
Key levels to watch: $1,000 is a psychological and structural resistance level. If the price cannot reclaim it, bears are likely to remain in control in the short term
The $860–$845 area is a zone of concentrated long liquidations and support at recent lows. If it breaks, the medium-term target is around $740. In principle, oversold conditions can trigger a technical rebound, but while ETF outflows continue and the price fails to decisively reclaim $1,000, any rebound is likely to be only a weak recovery
Only a high-volume hold above $1,000 could signal a substantial trend reversal$ZEC