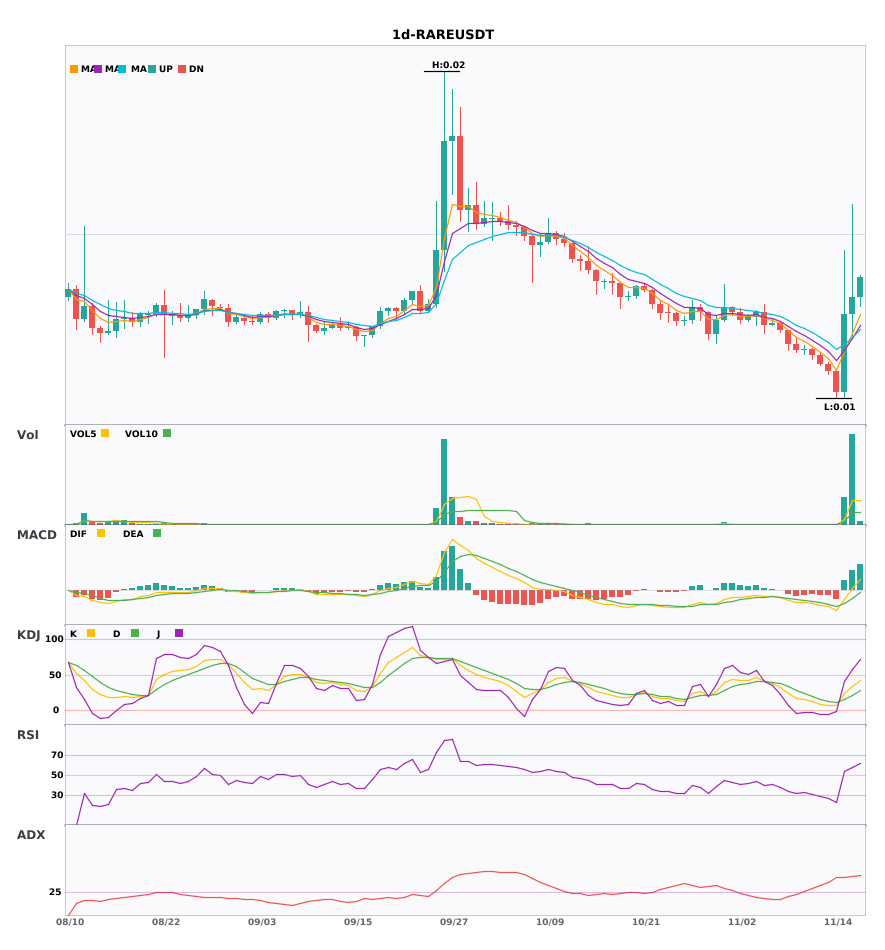
$RARE daily chart shows a bullish bias; golden cross on increased volume, with moving averages in bullish alignment 🔥
════════════════════
🔴 $RARE Daily Bullish Signal
⚠️ Technical analysis: ADX 48 indicates an extremely strong trend; watch for a pullback due to overbought conditions. MACD golden cross breaks above the zero line, signaling a bullish reversal. EMA5 crosses above EMA8, indicating a short-term bullish outlook. At a low level, KDJ's K crosses above D, but bearish momentum remains strong. Trading volume is up 8.8 times.
════════════════════
🔔 Follow to get the latest market movements 🔔
#技术分析 #RARE
📌 When trading, check whether the candlestick pattern is consistent
════════════════════
🔴 $RARE Daily Bullish Signal
⚠️ Technical analysis: ADX 48 indicates an extremely strong trend; watch for a pullback due to overbought conditions. MACD golden cross breaks above the zero line, signaling a bullish reversal. EMA5 crosses above EMA8, indicating a short-term bullish outlook. At a low level, KDJ's K crosses above D, but bearish momentum remains strong. Trading volume is up 8.8 times.
════════════════════
🔔 Follow to get the latest market movements 🔔
#技术分析 #RARE
📌 When trading, check whether the candlestick pattern is consistent