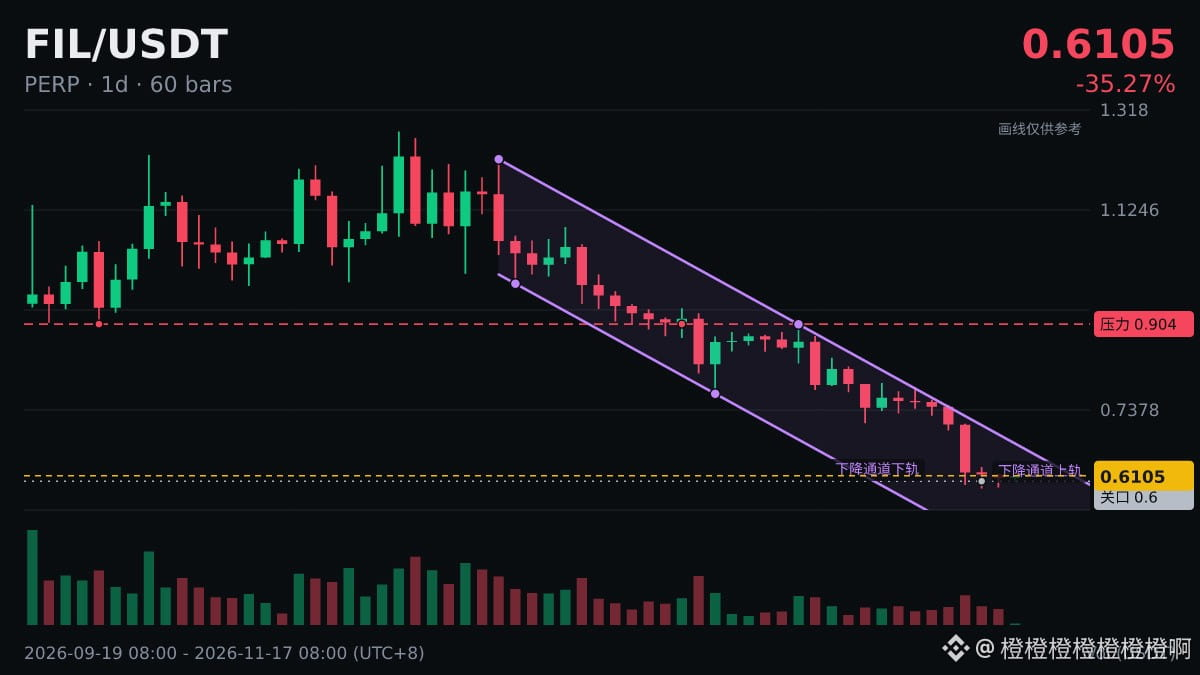
Technical Notes|$FIL |7 consecutive down days on the daily chart|Cumulative -20.37%
Definition: A bullish candlestick is one where the closing price is higher than the opening price; a bearish candlestick is one where the closing price is lower than the opening price. A bullish streak means several consecutive days closing with bullish candlesticks.
Common interpretation: Consecutive candles of the same color on the daily chart can also occur in a choppy market: several daily candles with small bodies may all be bullish or bearish, while the overall price move remains limited. In this case, the streak has little analytical value.
All indicators describe past price movements; the market can always move in the opposite direction.
#FIL
Just chatting—whether you make or lose money, you have to bear the consequences yourself.
Definition: A bullish candlestick is one where the closing price is higher than the opening price; a bearish candlestick is one where the closing price is lower than the opening price. A bullish streak means several consecutive days closing with bullish candlesticks.
Common interpretation: Consecutive candles of the same color on the daily chart can also occur in a choppy market: several daily candles with small bodies may all be bullish or bearish, while the overall price move remains limited. In this case, the streak has little analytical value.
All indicators describe past price movements; the market can always move in the opposite direction.
#FIL
Just chatting—whether you make or lose money, you have to bear the consequences yourself.