🔥 $ASTER Technical Update: Key Levels & Momentum Breakdown
📊 1. Market Snapshot
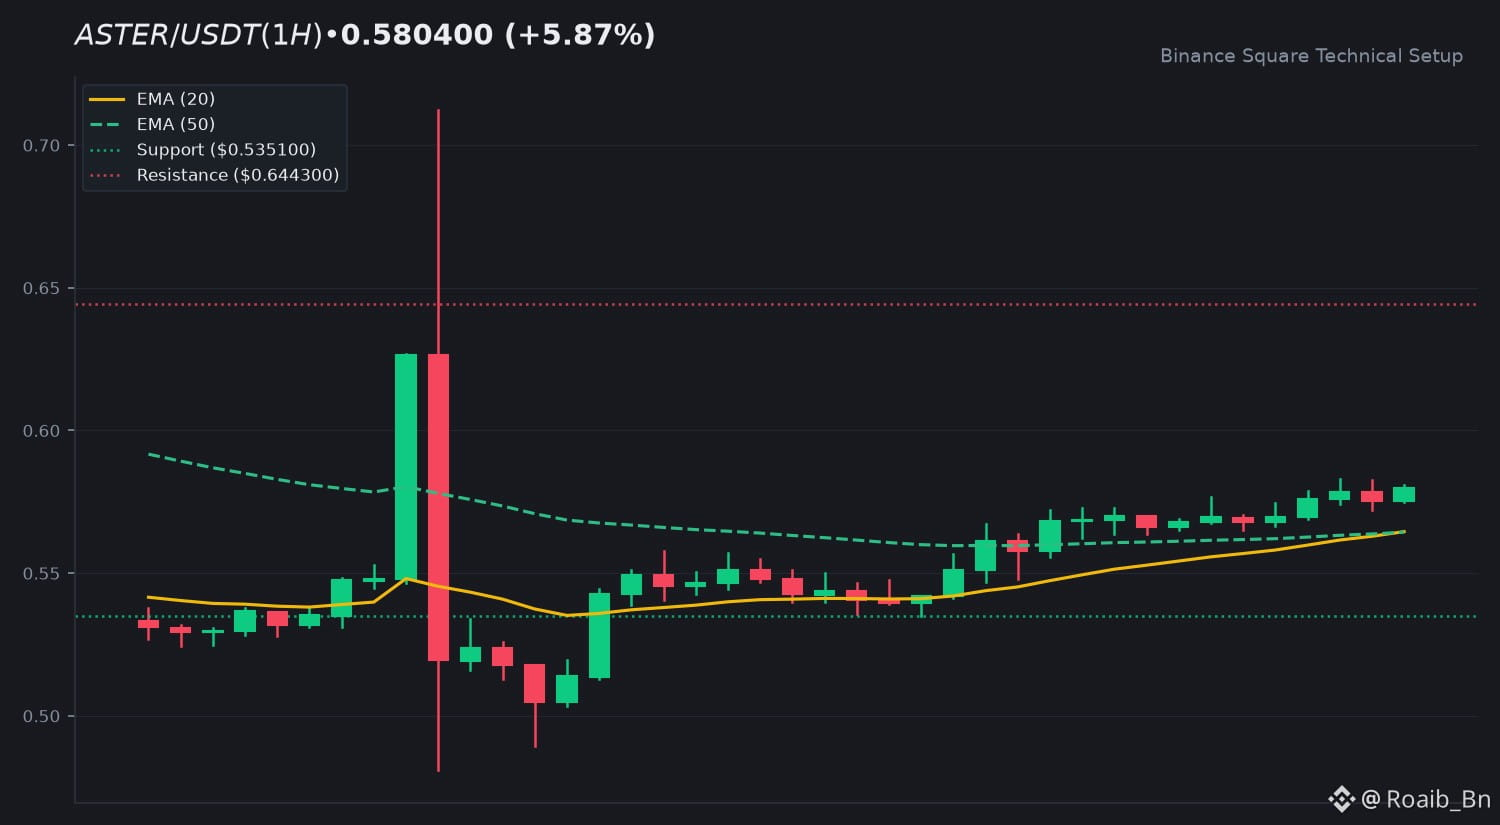
$ASTER is currently trading at 0.5804 USDT, reflecting a 24h gain of 5.87 percent. The asset has navigated a range between 0.5351 and 0.5829 over the last session. Current trading volume sits at 21,542,970 USDT, which is currently 0.22x relative to the 20-SMA, indicating a period of consolidation despite the positive price action.
📈 2. Technical Momentum & Indicator Bias
The EMA 20 at 0.5646 and EMA 50 at 0.5644 show a tight convergence, suggesting a neutral-to-bullish alignment. The RSI at 62.45 indicates moderate buying pressure, remaining well clear of overbought territory. The MACD histogram sits at +0.0015, with the MACD line hovering above the signal line, confirming a sustained trend bias.
🎯 3. Key Technical Levels to Watch
• 🟢 Resistance Zone: The primary resistance is identified at 0.6443, with a secondary extension level at 0.6695.
• 🔴 Support Zone: Initial support sits at 0.5351, followed by a deeper floor at 0.5177.
• 🛡️ Pivot Confluence: The 0.5644 area serves as the current pivot, where the EMAs offer a confluence of support for price action.
💡 4. Technical Takeaway & Risk Management
The current setup shows $ASTER maintaining a steady trend. Market participants often monitor the relationship between current price and the EMA dynamic support zones. Given the lower volume conviction, traders are observing whether the price can sustain levels above the EMA confluence to validate the current bullish posture.
💬 5. Community Discussion
What is your technical outlook for $ASTER this week? Are you accumulating or waiting for confirmation? Drop your thoughts below! 👇
⚠️ 6. Disclaimer
Educational technical analysis only. Not financial advice (NFA). Crypto markets involve risk. Always DYOR.
$ASTER #ASTER #BinanceSquare
📊 1. Market Snapshot
$ASTER is currently trading at 0.5804 USDT, reflecting a 24h gain of 5.87 percent. The asset has navigated a range between 0.5351 and 0.5829 over the last session. Current trading volume sits at 21,542,970 USDT, which is currently 0.22x relative to the 20-SMA, indicating a period of consolidation despite the positive price action.
📈 2. Technical Momentum & Indicator Bias
The EMA 20 at 0.5646 and EMA 50 at 0.5644 show a tight convergence, suggesting a neutral-to-bullish alignment. The RSI at 62.45 indicates moderate buying pressure, remaining well clear of overbought territory. The MACD histogram sits at +0.0015, with the MACD line hovering above the signal line, confirming a sustained trend bias.
🎯 3. Key Technical Levels to Watch
• 🟢 Resistance Zone: The primary resistance is identified at 0.6443, with a secondary extension level at 0.6695.
• 🔴 Support Zone: Initial support sits at 0.5351, followed by a deeper floor at 0.5177.
• 🛡️ Pivot Confluence: The 0.5644 area serves as the current pivot, where the EMAs offer a confluence of support for price action.
💡 4. Technical Takeaway & Risk Management
The current setup shows $ASTER maintaining a steady trend. Market participants often monitor the relationship between current price and the EMA dynamic support zones. Given the lower volume conviction, traders are observing whether the price can sustain levels above the EMA confluence to validate the current bullish posture.
💬 5. Community Discussion
What is your technical outlook for $ASTER this week? Are you accumulating or waiting for confirmation? Drop your thoughts below! 👇
⚠️ 6. Disclaimer
Educational technical analysis only. Not financial advice (NFA). Crypto markets involve risk. Always DYOR.
$ASTER #ASTER #BinanceSquare