$BTC
📊 BTC/USDT Market Analysis – What's Next for Bitcoin?
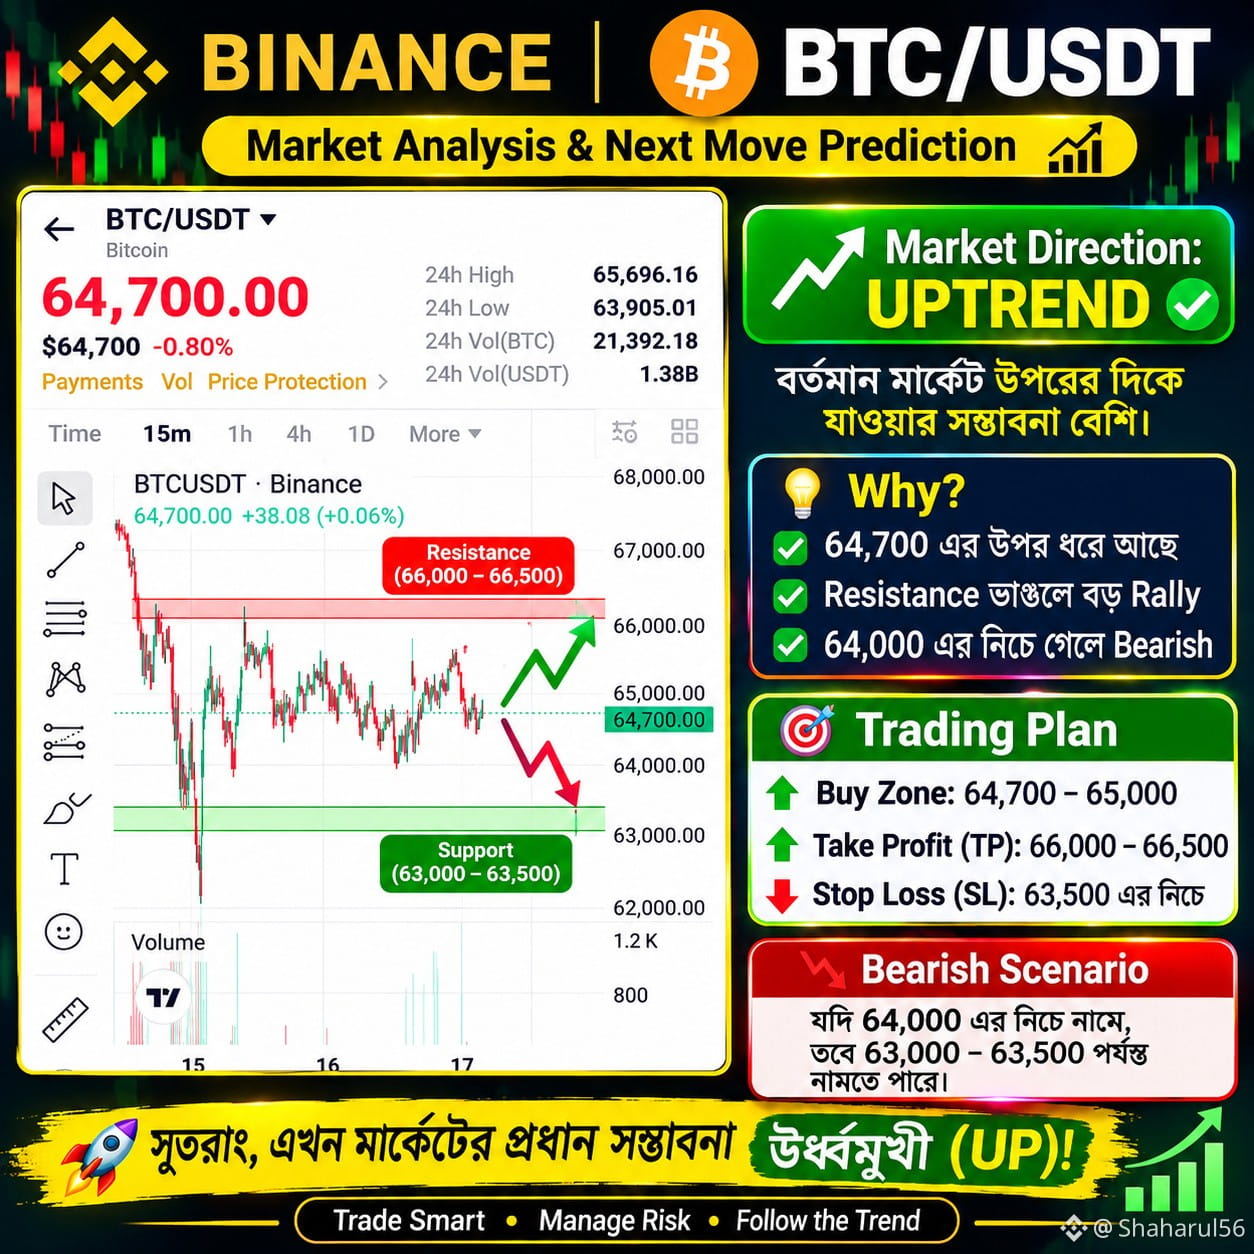
Bitcoin is currently trading around $64,700, showing signs of consolidation after a significant price decline.
🔍 15-Minute Chart Analysis
📌 Current Price: $64,700
📈 24H High: $65,696.16
📉 24H Low: $63,905.01
Important Levels:
🔴 Resistance: $65,000 – $65,300
🔴 Major Resistance: $65,500 – $65,700
🟢 Support: $64,000
🟢 Major Support: $63,900
📊 Market Direction:
My current outlook is SIDEWAYS with a slight bearish bias.
🚀 Bullish Scenario:
If BTC breaks above $65,300 and maintains momentum, it could move toward $65,500–$65,700.
🔻 Bearish Scenario:
If BTC breaks below $64,000 with strong selling pressure, a move toward $63,900 or lower becomes possible.
⚠️ My Observation:
The market has not confirmed a clear trend reversal yet. Wait for breakout confirmation before making any trading decisions.
What do you think?
🚀 Bullish or 🔻 Bearish?
#BTC #Bitcoin #CryptoAnalysis #Binance #trading
📊 BTC/USDT Market Analysis – What's Next for Bitcoin?
Bitcoin is currently trading around $64,700, showing signs of consolidation after a significant price decline.
🔍 15-Minute Chart Analysis
📌 Current Price: $64,700
📈 24H High: $65,696.16
📉 24H Low: $63,905.01
Important Levels:
🔴 Resistance: $65,000 – $65,300
🔴 Major Resistance: $65,500 – $65,700
🟢 Support: $64,000
🟢 Major Support: $63,900
📊 Market Direction:
My current outlook is SIDEWAYS with a slight bearish bias.
🚀 Bullish Scenario:
If BTC breaks above $65,300 and maintains momentum, it could move toward $65,500–$65,700.
🔻 Bearish Scenario:
If BTC breaks below $64,000 with strong selling pressure, a move toward $63,900 or lower becomes possible.
⚠️ My Observation:
The market has not confirmed a clear trend reversal yet. Wait for breakout confirmation before making any trading decisions.
What do you think?
🚀 Bullish or 🔻 Bearish?
#BTC #Bitcoin #CryptoAnalysis #Binance #trading