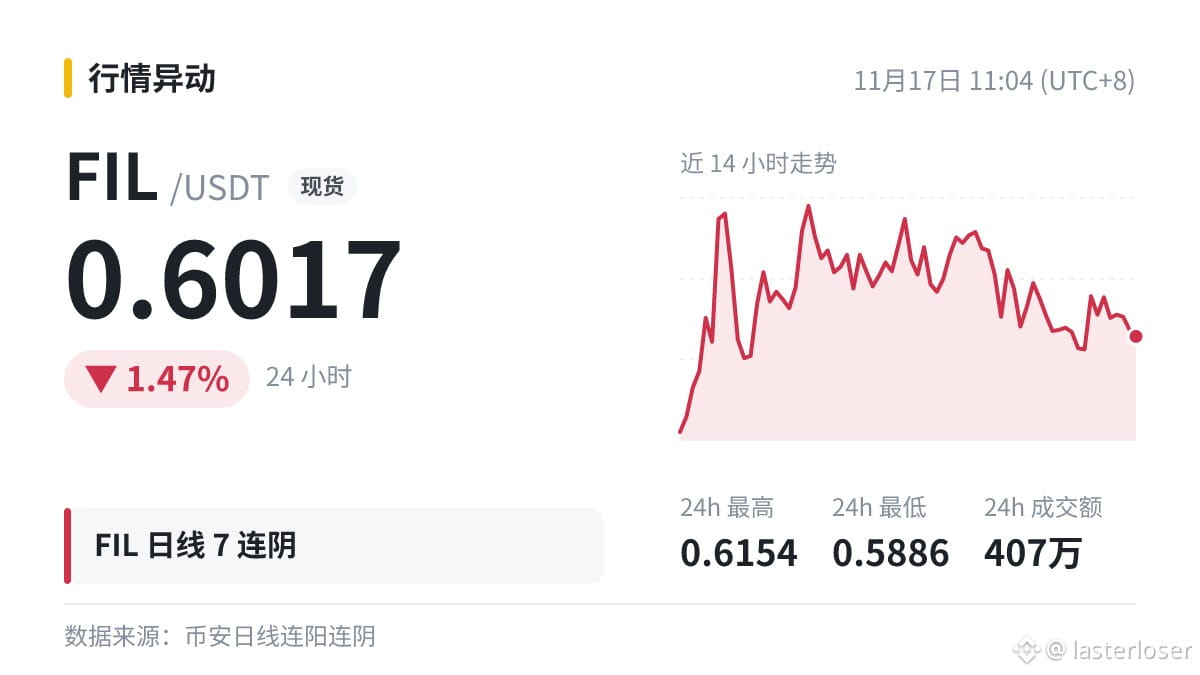
$FIL Seven consecutive down days on the daily chart, with a cumulative decline of 20.37%; today’s decline so far is 0.76%.
Let’s use this data to talk about consecutive down days on the daily chart.
The number of consecutive down days alone is not a reason to trade. Many people pay closer attention to whether trading volume is increasing or decreasing across that run of candlesticks.
After consecutive candlesticks move in the same direction, the price has often moved well away from its short-term moving average, and a pullback toward the average is also common.
Extreme readings usually mean more dramatic swings. At such times, it’s better to reduce leverage rather than make a large bet.
#FIL
Let’s use this data to talk about consecutive down days on the daily chart.
The number of consecutive down days alone is not a reason to trade. Many people pay closer attention to whether trading volume is increasing or decreasing across that run of candlesticks.
After consecutive candlesticks move in the same direction, the price has often moved well away from its short-term moving average, and a pullback toward the average is also common.
Extreme readings usually mean more dramatic swings. At such times, it’s better to reduce leverage rather than make a large bet.
#FIL