Vortex lines: How can you tell whether directional dominance is holding?
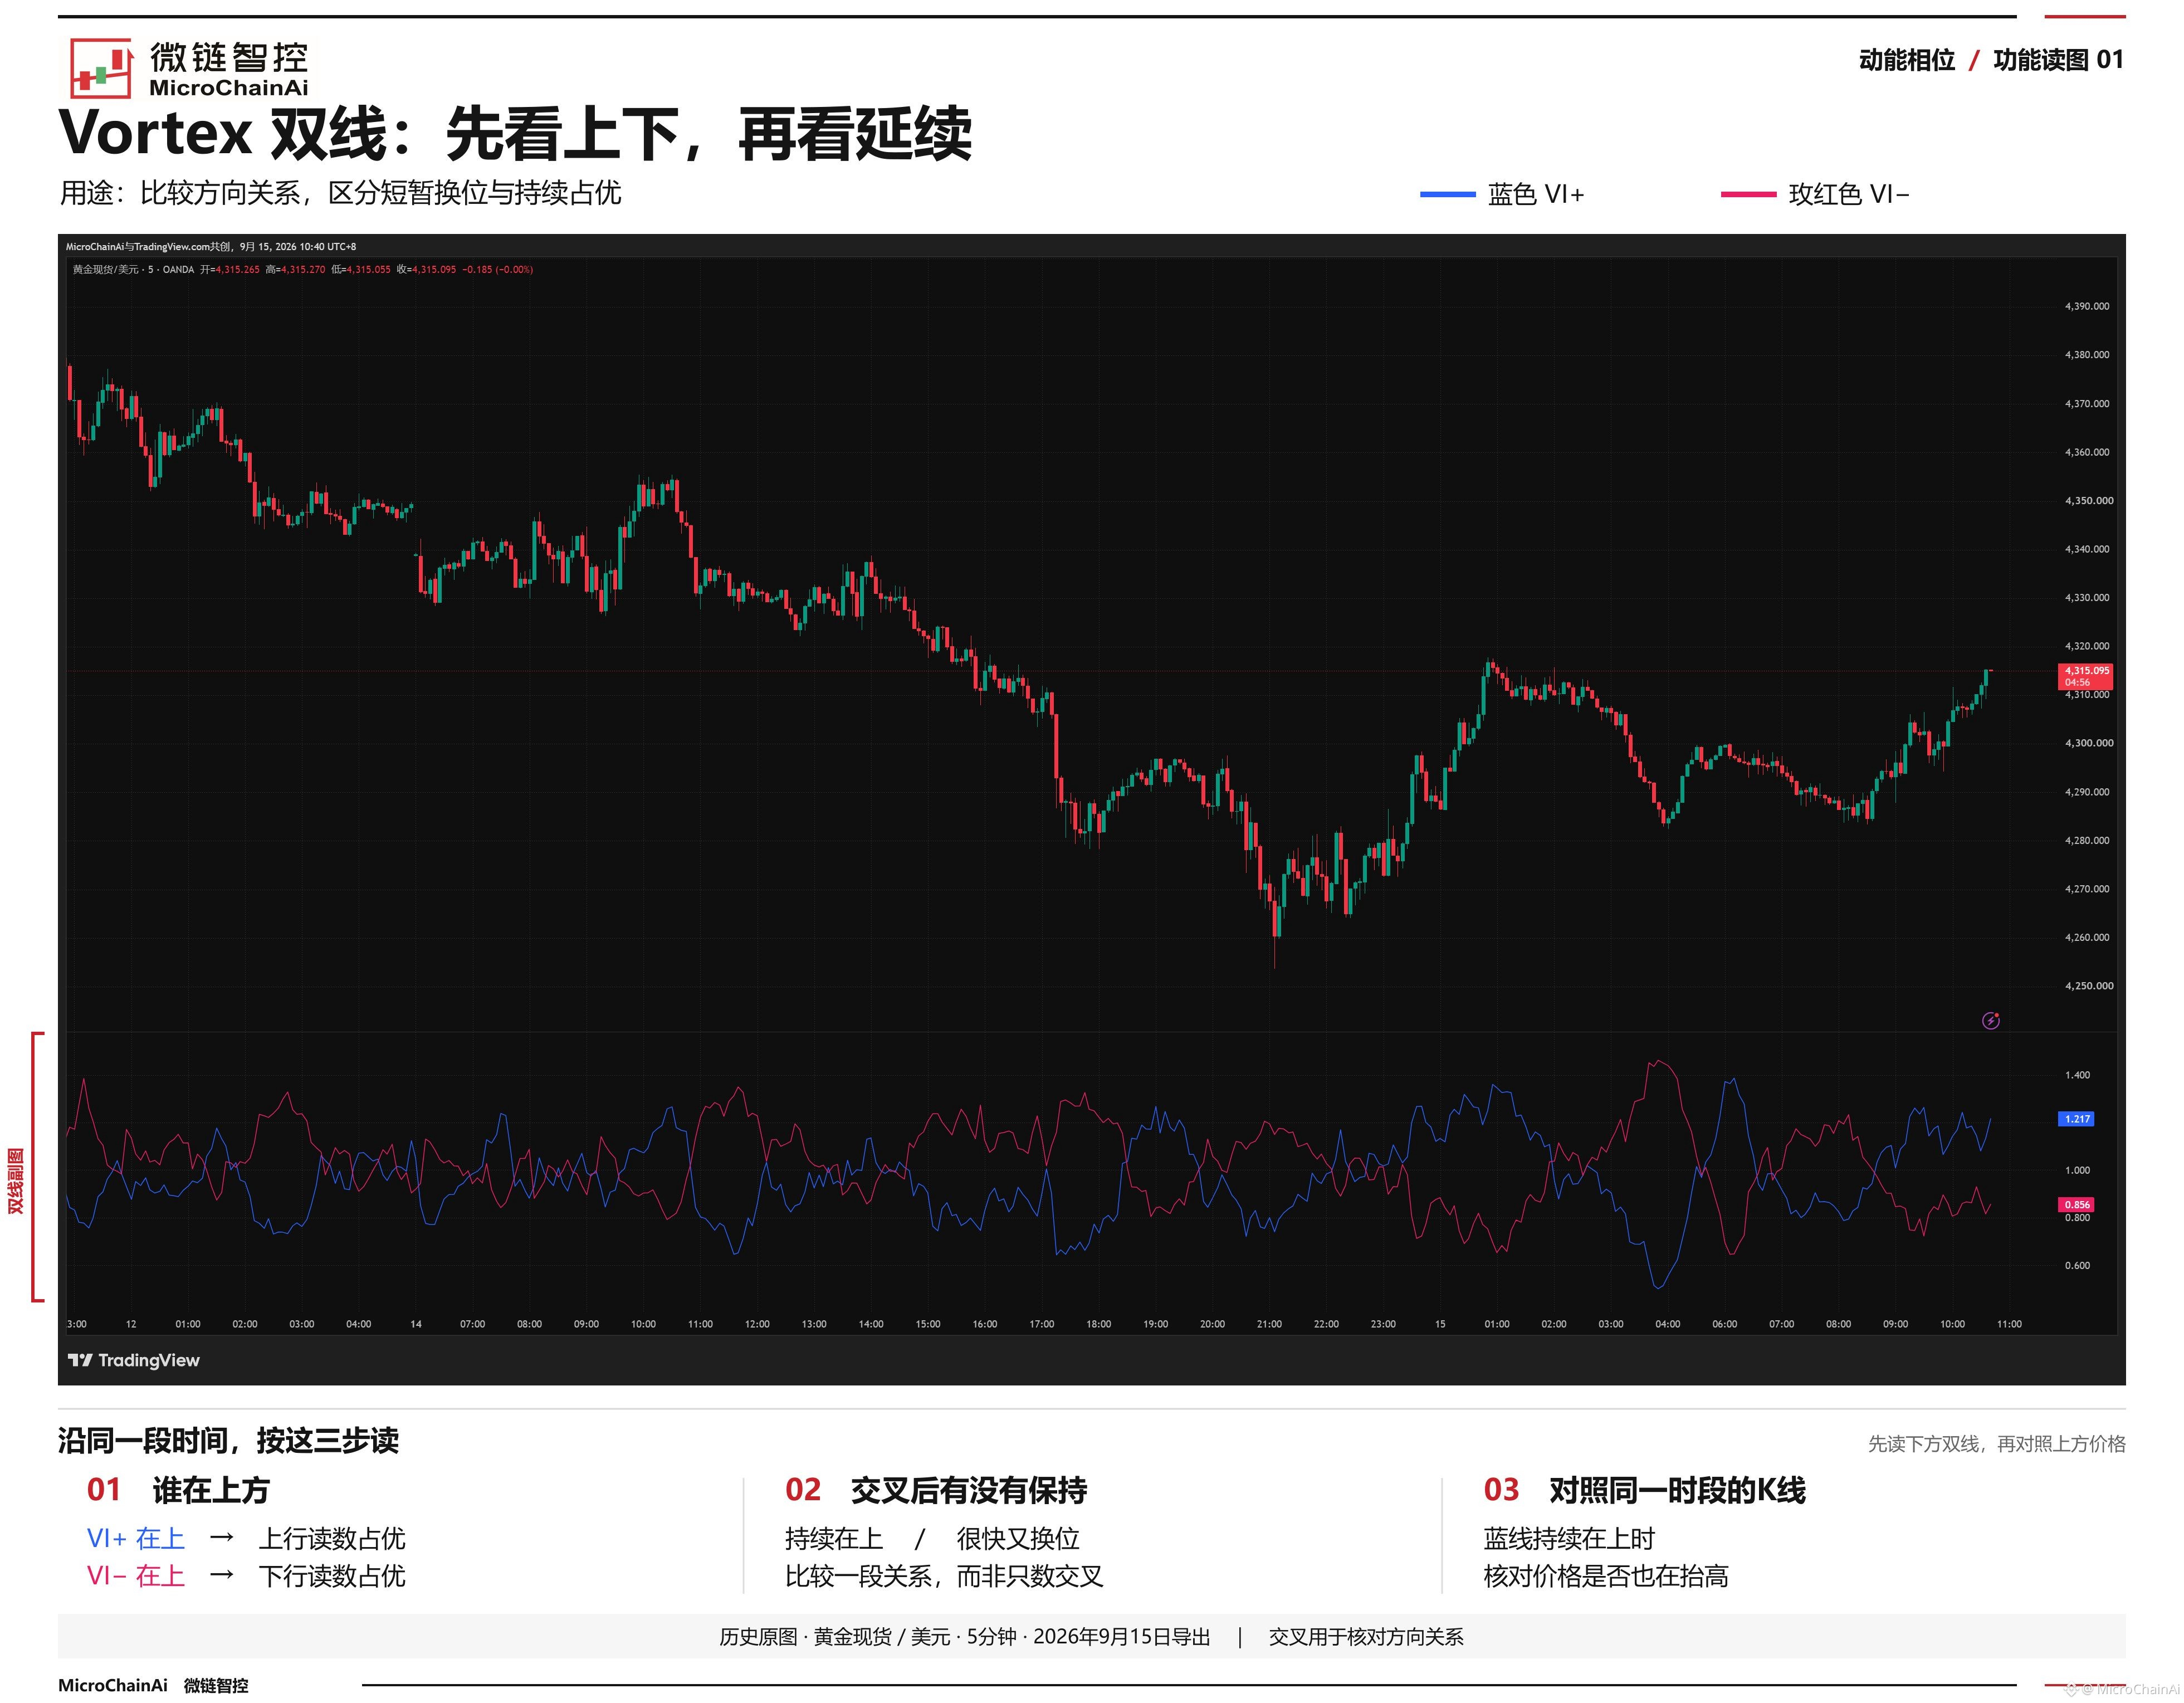
🔍 In 【Momentum Phase】, Vortex compares directional movement to the upside and downside. After enabling this module, look for the blue VI+ and magenta VI− in the sub-chart.
👀 First, see which line is on top: if the blue line is above, upside readings dominate; if the magenta line is above, downside readings dominate. Then follow them to the right over time: after they cross, does one stay ahead, or do they switch places again quickly?
🧭 For example, if the blue line crosses above and stays there, compare it with the candlesticks above for the same period to see whether prices are also rising. If the two lines cross repeatedly, their directional relationship is switching back and forth. This helps distinguish a brief switch in position from sustained dominance; treat the crossover only as a starting point for verification.
#动能相位 #指标读法
🔍 In 【Momentum Phase】, Vortex compares directional movement to the upside and downside. After enabling this module, look for the blue VI+ and magenta VI− in the sub-chart.
👀 First, see which line is on top: if the blue line is above, upside readings dominate; if the magenta line is above, downside readings dominate. Then follow them to the right over time: after they cross, does one stay ahead, or do they switch places again quickly?
🧭 For example, if the blue line crosses above and stays there, compare it with the candlesticks above for the same period to see whether prices are also rising. If the two lines cross repeatedly, their directional relationship is switching back and forth. This helps distinguish a brief switch in position from sustained dominance; treat the crossover only as a starting point for verification.
#动能相位 #指标读法