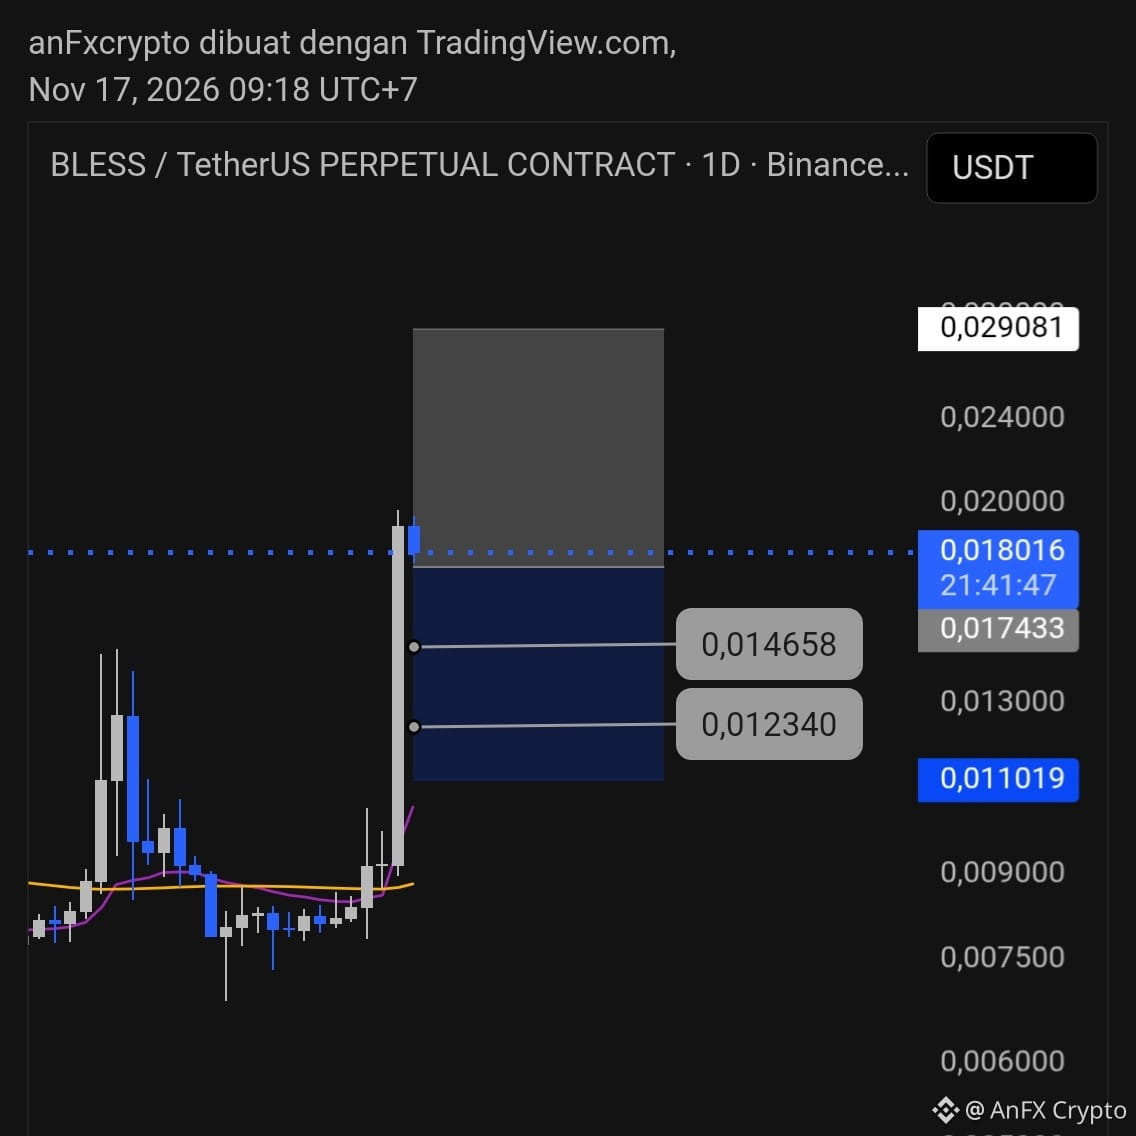
Technical Analysis $BLESS /USDT (Timeframe Daily/1D):
Structure & Trend: The chart shows a massive volume spike near the bottom, followed by an impulsive breakout from the previous consolidation/sideways phase.
Key Price Zones:
Support/Demand Area: Rp0,012340 – Rp0,014658 (blue box).
Resistance Target Level: Rp0,024000 – Rp0,029081 (gray box).
Trading Signals:
Action: Buy on Pullback / Long Entry.
Entry Zone: Rp0,014500 – Rp0,015500 (waiting for a retest of the nearest support area).
Take-Profit Targets (TP):
TP 1: Rp0,020000
TP 2: Rp0,024000
TP 3: Rp0,029000
Stop Loss (SL): Below Rp0,011000 (to account for a potential invalidation of the breakout structure).
Structure & Trend: The chart shows a massive volume spike near the bottom, followed by an impulsive breakout from the previous consolidation/sideways phase.
Key Price Zones:
Support/Demand Area: Rp0,012340 – Rp0,014658 (blue box).
Resistance Target Level: Rp0,024000 – Rp0,029081 (gray box).
Trading Signals:
Action: Buy on Pullback / Long Entry.
Entry Zone: Rp0,014500 – Rp0,015500 (waiting for a retest of the nearest support area).
Take-Profit Targets (TP):
TP 1: Rp0,020000
TP 2: Rp0,024000
TP 3: Rp0,029000
Stop Loss (SL): Below Rp0,011000 (to account for a potential invalidation of the breakout structure).