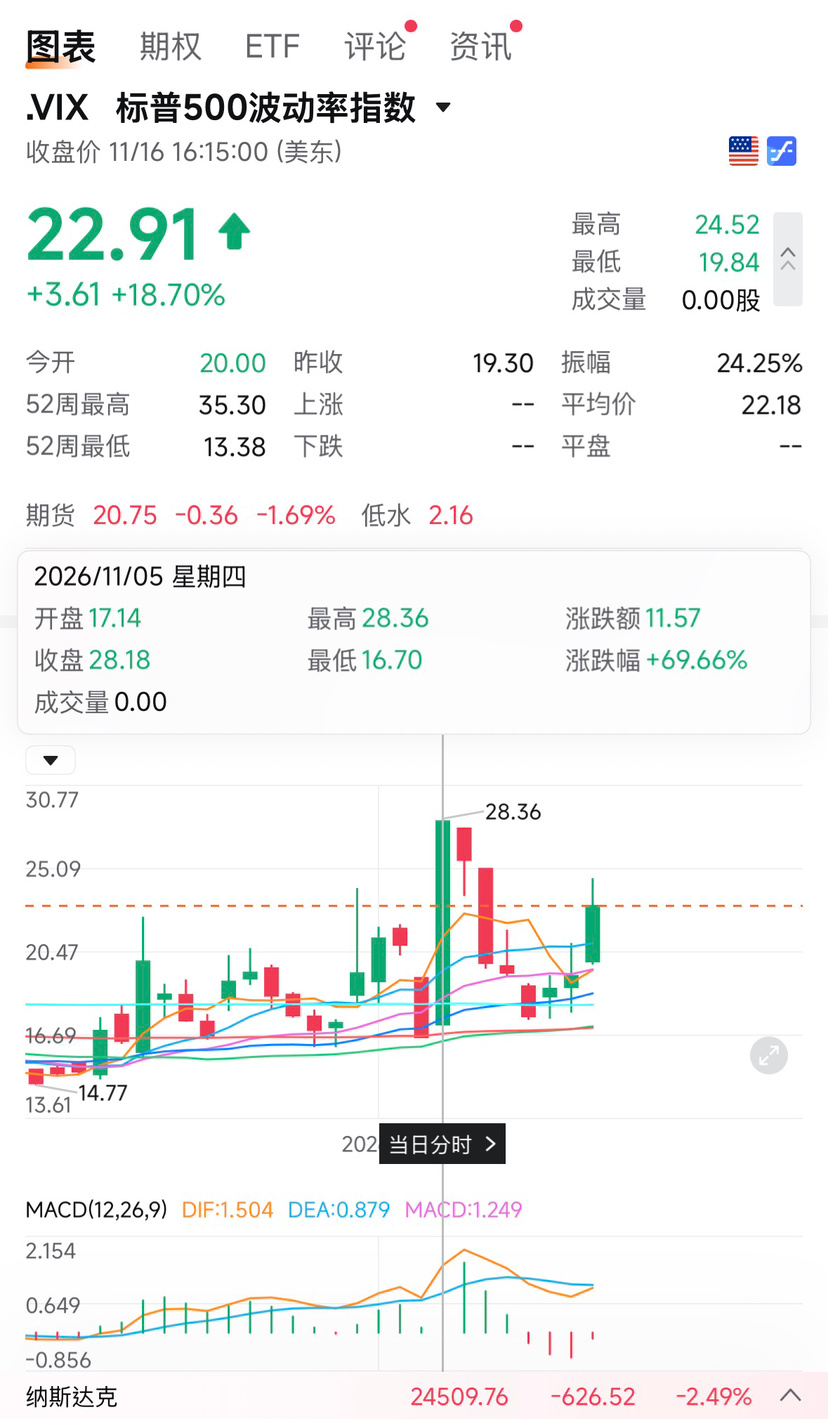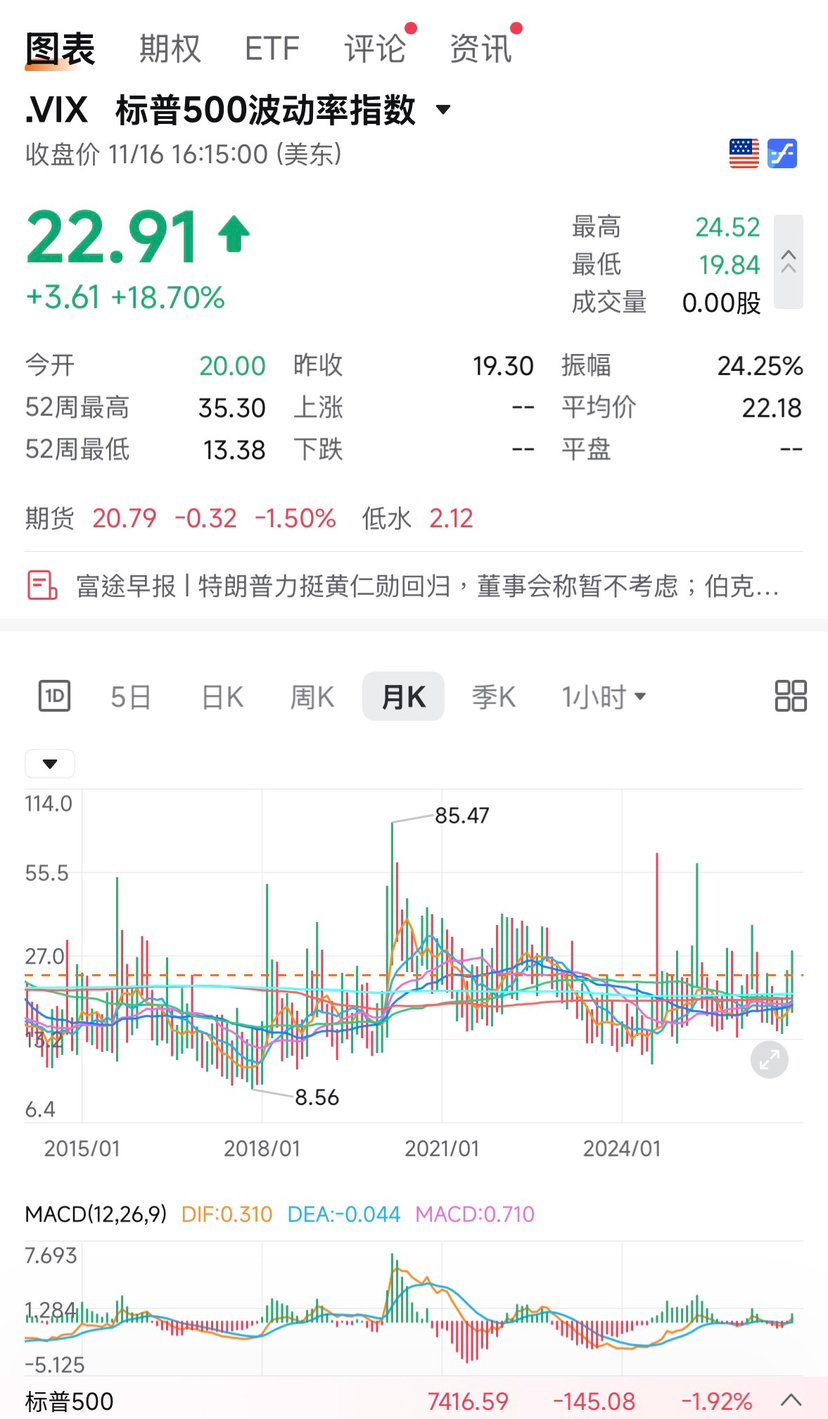


As of the close of U.S. markets on November 16, 2026 (early morning on November 17, Beijing time), the CBOE Volatility Index (VIX) has generally followed a pattern in Q4 2026 (from October 1 to date) of “falling first, then rising, with sharp spikes and an upward shift in its average level.”
Since the start of this quarter, the VIX has gradually risen from a low of around 14.84 in early October into the elevated-volatility range above 20. In early November, it even surged nearly 70% in a single day, an extreme move.
I. Overview of key data for Q4 2026 (October 1–November 16)
| Statistical dimension | Value / date | Notes |
|---|---|---|
| Opening benchmark for the quarter | 16.39 (October 1 close) | Continued the low-volatility environment at the end of Q3 |
| Quarter's lowest close | 14.84 (October 9) | Briefly dipped to around 14.84 in early October |
| Quarter's highest close | 28.18 (November 5) | Hit an intraday high of 28.36 on November 5, setting a Q4 peak |
| Latest closing level | 22.91 (November 16) | Up +39.78% cumulatively since early October |
| Largest single-day gain | +69.66% (November 5) | Surged from 16.61 the previous day to 28.18 |
| Largest single-day decline | -22.31% (November 9) | Fell back from 25.64 to 19.92 after the panic spike faded |
II. Review of Volatility Trends by Phase
1. First half of October (October 1–October 15): Low-volatility base-building phase (14.84–16.87)
* Trend characteristics: Market sentiment was steady, with the VIX staying in the comfortable 15–17 range throughout.
* Key points: From October 6 through October 13, the VIX closed below 15.50 for six consecutive trading days. On October 9, it closed at 14.84, the quarter's lowest closing level to date.
2. Second half of October (October 16–October 30): Higher range, repeated tests of the 20 mark (16.68–19.99)
* Trend characteristics: As earnings season and macroeconomic data added to market uncertainty, the VIX floor rose above 16.6. It repeatedly tested the psychological 20 mark to the upside but never managed to close above 20.
* Key points:
* October 16: Jumped 21.45% in a single day, reaching an intraday high of 22.31 and closing at 19.99, its first near-test of the 20 mark.
* October 22–30: Traded in a wide range of 17–19.5. On October 30, it briefly surged to an intraday high of 23.93 before ultimately closing at 19.42, foreshadowing November's sharp volatility.
3. Early November (November 2–November 6): Black swan spike and sharp, wide-ranging swings (16.61–28.18)
* Trend characteristics: Volatility saw the quarter's most dramatic “roller-coaster” moves, decisively breaking above the 20 threshold and triggering short-term panic.
* Key points:
* November 2–3: Closed above 20 for two consecutive days (21.15 and 20.83).
* November 4–5 (extreme reversal): On November 4, the VIX briefly plunged 20.26% to 16.61. The very next day, November 5, it soared 69.66% in a single day, reaching an intraday high of 28.36 and closing at 28.18—the quarter's highest point of panic.
* November 6: Traded at elevated levels and closed at 25.64 (intraday high: 27.76).
4. Mid-November to date (November 9–November 16): Rallied again after a brief pullback (17.49–22.91)
* Trend characteristics: After the panic spike, the VIX briefly pulled back to around 17.5 and consolidated. But this Monday (November 16), amid a pullback in tech and semiconductor stocks and a repricing of macroeconomic expectations, it surged again on increased volume.
* Key points:
* November 9–11: Sentiment recovered quickly and the VIX fell for several consecutive sessions, closing at 17.49 on November 11 (the phase low).
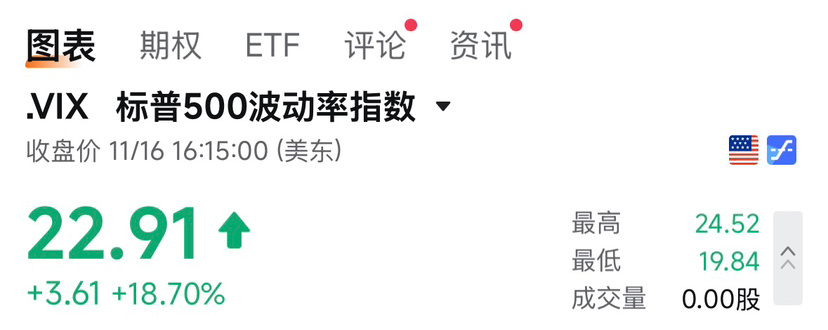
* November 12–16: Volatility resumed its upward trend, climbing gradually from 18.70. On November 16, it jumped 18.70% in a single day, reaching an intraday high of 24.52 and closing at 22.91, returning to a moderately elevated volatility range.
III. Closing Data for Key Trading Days (October–November)
* Representative October levels: 10/01 (16.39) → 10/09 (14.84, quarter low) → 10/16 (19.99) → 10/21 (16.68) → 10/23 (19.45) → 10/30 (19.42)
* November daily closes:
* 11/02: 21.15 | 11/03: 20.83 | 11/04: 16.61 | 11/05: 28.18 (quarter high) | 11/06: 25.64
* 11/09: 19.92 | 11/10: 19.46 | 11/11: 17.49 | 11/12: 18.70 | 11/13: 19.30 | 11/16: 22.91
IV. Trend Summary
Looking at the fourth quarter as a whole, U.S. equity volatility has left behind the “low-volatility warm-water zone” around 15 in early October and entered a high-volatility phase, with a “normal range of 17–19 and spike highs of 24–28.” As long as the VIX stays above 20, intraday swings and the intensity of the bull-bear tug-of-war in the broader U.S. market (especially the Nasdaq and high-valuation tech stocks) are likely to remain elevated.