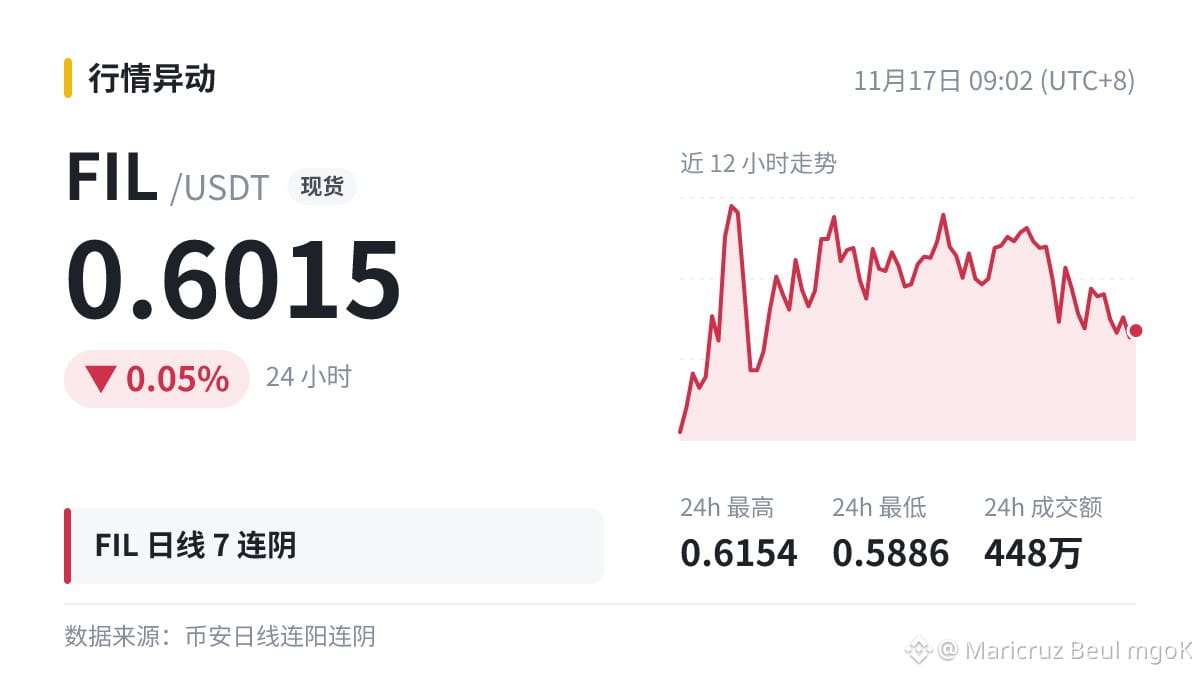
$FIL On the 7th day of consecutive down days on the daily chart, I usually look at three things:
1) How big is the drop? -20.37%—quite substantial, so a rebound after such a steep decline may be coming;
2) Has the losing streak been broken today? It's currently down 0.79%, so not yet;
3) What was the volume on the day it breaks? A bullish candlestick on higher volume is more convincing than one on lower volume.
Are you bullish or leaning bearish from here?
1) How big is the drop? -20.37%—quite substantial, so a rebound after such a steep decline may be coming;
2) Has the losing streak been broken today? It's currently down 0.79%, so not yet;
3) What was the volume on the day it breaks? A bullish candlestick on higher volume is more convincing than one on lower volume.
Are you bullish or leaning bearish from here?