🔥 $SPCXB Technical Update: Key Levels & Momentum Breakdown
📊 1. Market Snapshot
The current price for $SPCXB is 137.6200 USDT, reflecting a 24h change of -1.76 percent. Trading activity remains subdued with a 24h quote volume of 64,066,200 USDT. Current volume levels relative to the 20-SMA are at 0.02x, indicating a period of low market conviction and consolidation.
📈 2. Technical Momentum & Indicator Bias
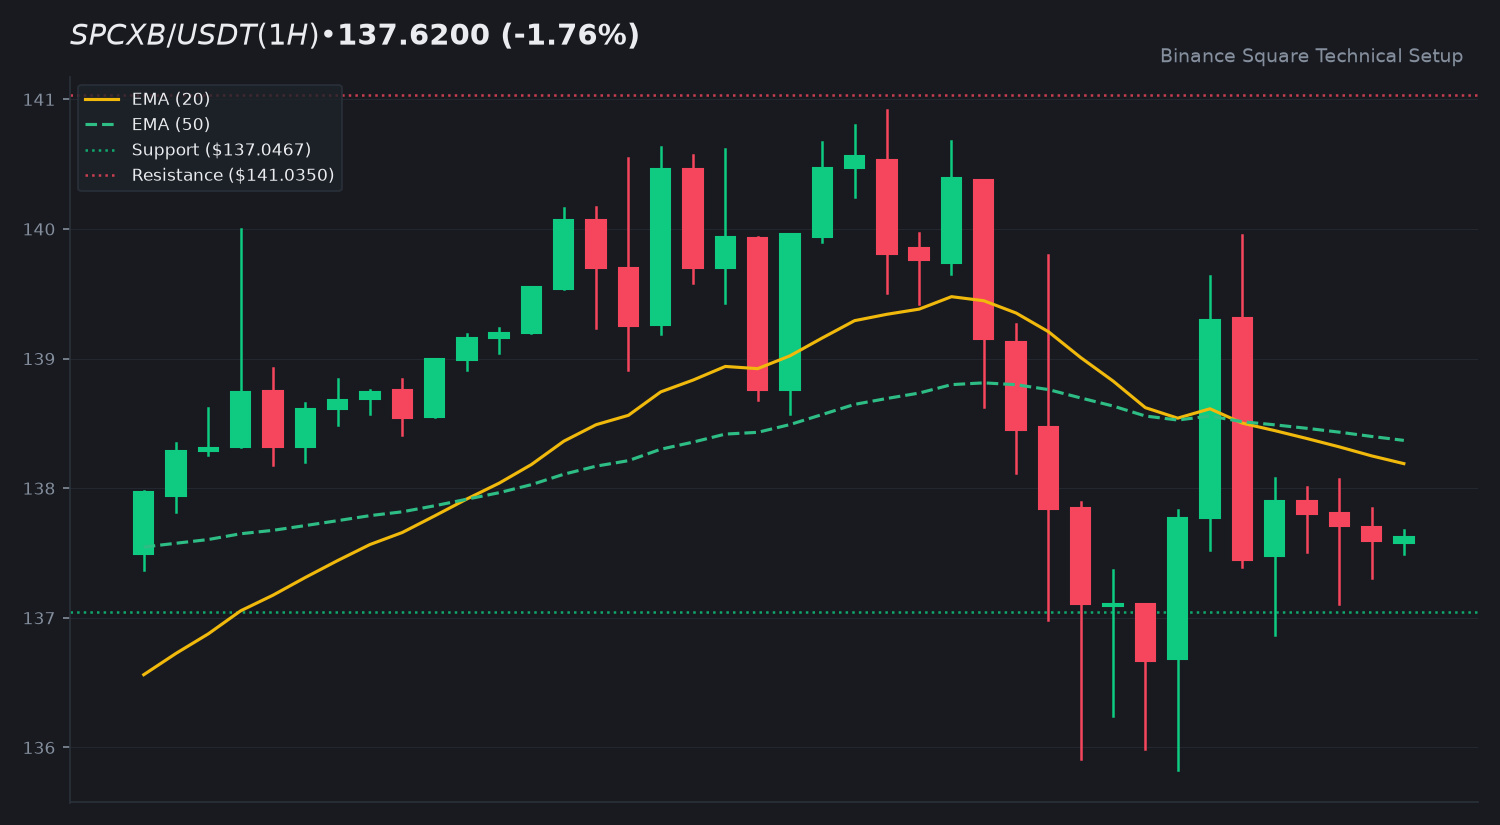
Price action for $SPCXB is currently trading below both the EMA 20 at 138.1898 and the EMA 50 at 138.3691. This positioning suggests a persistent short-term bearish bias. The RSI at 45.36 reflects neutral momentum, neither overbought nor oversold. Meanwhile, the MACD histogram is at -0.1122, with the MACD line below the signal line, confirming a lack of bullish divergence in the immediate timeframe.
🎯 3. Key Technical Levels to Watch
• 🟢 Resistance Zone: The immediate resistance level is identified at 141.0350.
• 🔴 Support Zone: The primary support floor is currently holding at 137.0467.
• 🛡️ Pivot Confluence: The EMA 20 at 138.1898 acts as a critical pivot point for potential trend reversal.
💡 4. Technical Takeaway & Risk Management
The asset is currently consolidating in a tight range. Market participants are monitoring the interaction between price action and the EMA dynamic resistance levels. A breakout above the EMA 50 would be required to shift the current technical bias. Prudent risk management involves observing how the price reacts to the established support floor before considering any shifts in position.
💬 5. Community Discussion
What is your technical outlook for $SPCXB this week? Are you accumulating or waiting for confirmation? Drop your thoughts below! 👇
⚠️ 6. Disclaimer
Educational technical analysis only. Not financial advice (NFA). Crypto markets involve risk. Always DYOR.
$SPCXB #SPCXB #BinanceSquare
📊 1. Market Snapshot
The current price for $SPCXB is 137.6200 USDT, reflecting a 24h change of -1.76 percent. Trading activity remains subdued with a 24h quote volume of 64,066,200 USDT. Current volume levels relative to the 20-SMA are at 0.02x, indicating a period of low market conviction and consolidation.
📈 2. Technical Momentum & Indicator Bias
Price action for $SPCXB is currently trading below both the EMA 20 at 138.1898 and the EMA 50 at 138.3691. This positioning suggests a persistent short-term bearish bias. The RSI at 45.36 reflects neutral momentum, neither overbought nor oversold. Meanwhile, the MACD histogram is at -0.1122, with the MACD line below the signal line, confirming a lack of bullish divergence in the immediate timeframe.
🎯 3. Key Technical Levels to Watch
• 🟢 Resistance Zone: The immediate resistance level is identified at 141.0350.
• 🔴 Support Zone: The primary support floor is currently holding at 137.0467.
• 🛡️ Pivot Confluence: The EMA 20 at 138.1898 acts as a critical pivot point for potential trend reversal.
💡 4. Technical Takeaway & Risk Management
The asset is currently consolidating in a tight range. Market participants are monitoring the interaction between price action and the EMA dynamic resistance levels. A breakout above the EMA 50 would be required to shift the current technical bias. Prudent risk management involves observing how the price reacts to the established support floor before considering any shifts in position.
💬 5. Community Discussion
What is your technical outlook for $SPCXB this week? Are you accumulating or waiting for confirmation? Drop your thoughts below! 👇
⚠️ 6. Disclaimer
Educational technical analysis only. Not financial advice (NFA). Crypto markets involve risk. Always DYOR.
$SPCXB #SPCXB #BinanceSquare