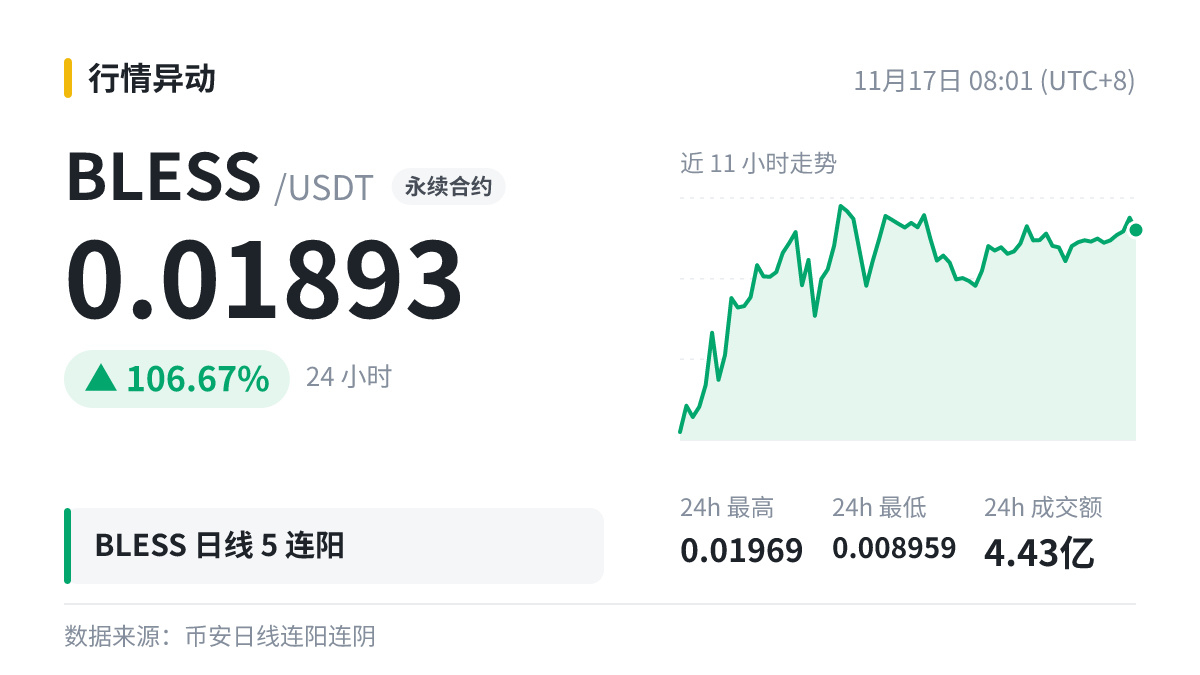
‼️ $BLESS The daily chart has risen for 5 consecutive days 🔥
Don’t get carried away just yet—first, make sure you understand consecutive bullish and bearish candles 👇
A bullish candle is one where the closing price is higher than the opening price; a bearish candle is one where the closing price is lower than the opening price. Consecutive bullish candles mean bullish candles have formed for several days in a row.
Some people like to compare daily and weekly charts: when the weekly trend points in the same direction, a run of same-colored daily candles is often more likely to continue for a while; when the trends move in opposite directions, you should be more cautious.
All indicators are based on past market movements, and prices can absolutely move in the opposite direction.
Don’t get carried away just yet—first, make sure you understand consecutive bullish and bearish candles 👇
A bullish candle is one where the closing price is higher than the opening price; a bearish candle is one where the closing price is lower than the opening price. Consecutive bullish candles mean bullish candles have formed for several days in a row.
Some people like to compare daily and weekly charts: when the weekly trend points in the same direction, a run of same-colored daily candles is often more likely to continue for a while; when the trends move in opposite directions, you should be more cautious.
All indicators are based on past market movements, and prices can absolutely move in the opposite direction.