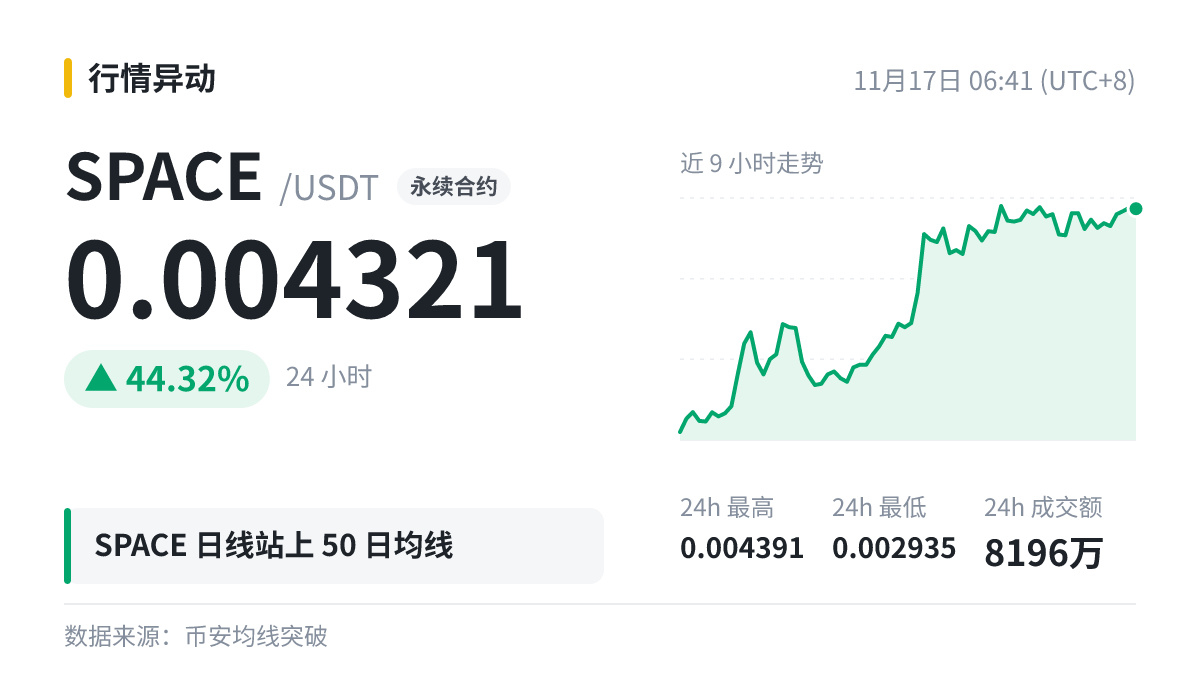
$SPACE daily chart has moved above MA50 (0.003963), with the current price at 0.004321.
MA50 reflects the medium-term trend. After moving above it, the key is whether the price can hold near the moving average on a pullback. If it does, the trend is improving.
Indicators describe the past; price moves toward the future, so don't treat them as predictions. If it were you, would you act now or wait a little longer?
MA50 reflects the medium-term trend. After moving above it, the key is whether the price can hold near the moving average on a pullback. If it does, the trend is improving.
Indicators describe the past; price moves toward the future, so don't treat them as predictions. If it were you, would you act now or wait a little longer?