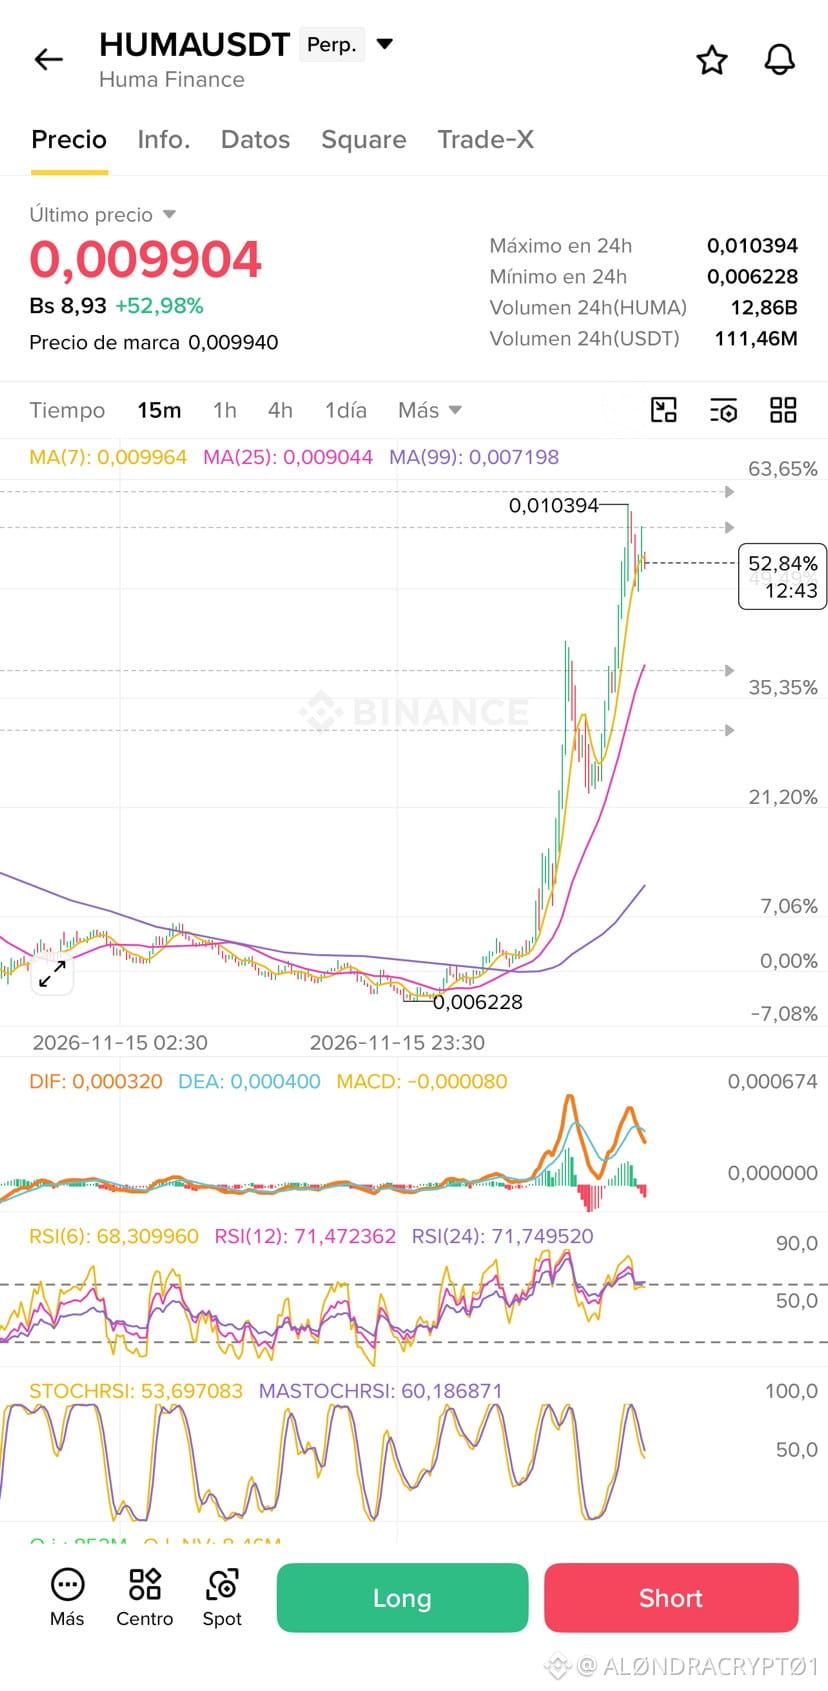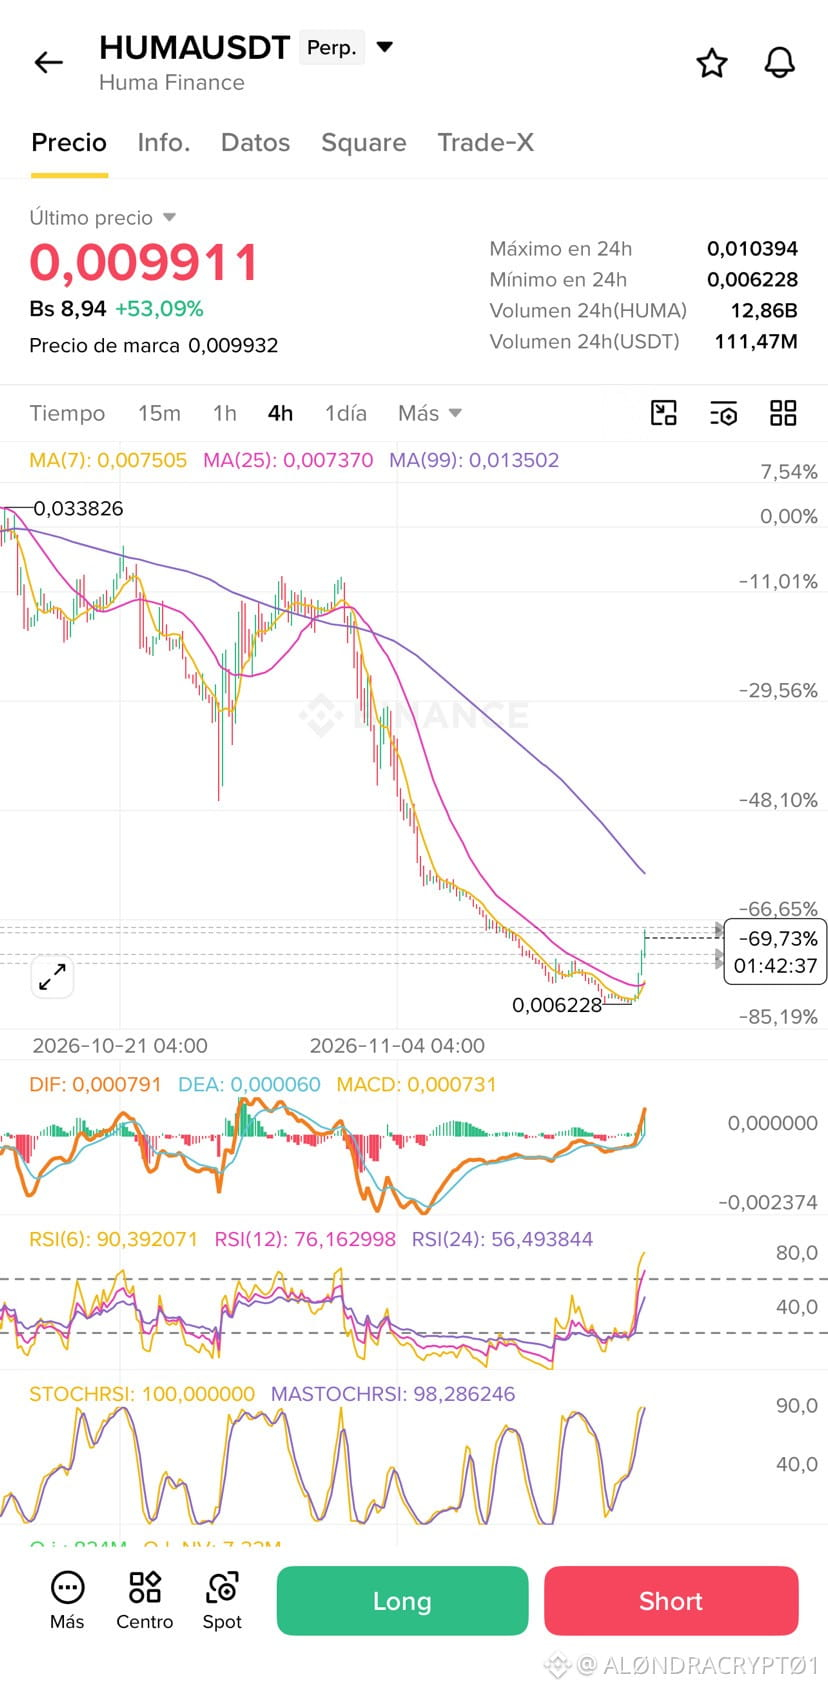

$HUMA Currently trading at $0.009911, after reaching a daily high of $0.010394 and a low of $0.006228, maintaining a gain of nearly 53 percent for the day.
On the 15-minute timeframe, the RSI indicator shows a healthy pullback from the extreme overbought zone to around 68, while the stochastic has dropped toward the midpoint (53), reflecting a necessary pause in bullish momentum after the strong rally.
✔️Potential long entry: Wait for the price to correct in a controlled manner and find support in the $0.00850 to $0.00900 range.
- Take Profit 1: $0.00960
- Take Profit 2: $0.01020
- Stop Loss: $0.00790
✔️ Potential short entry: Watch for a rejection or loss of momentum if the price tries to reclaim the upper resistance zone between $0.01020 and $0.01050.
- Take Profit 1: $0.00940
- Take Profit 2: $0.00870
- Stop Loss: $0.01075
📌 Remember to always confirm volume behavior and candle structure on the 15-minute timeframe after any liquidity sweep or long wick, and always trade with prudent risk management.
What do you think of HUMA's current price action after this breather on the chart? Would you rather look for a bounce lower down or a short higher up?
✨ Follow me so you don't miss any analysis and can trade strategically!
Legal disclaimer: Educational content, not financial advice.
#AnalisisTecnico
On the 15-minute timeframe, the RSI indicator shows a healthy pullback from the extreme overbought zone to around 68, while the stochastic has dropped toward the midpoint (53), reflecting a necessary pause in bullish momentum after the strong rally.
✔️Potential long entry: Wait for the price to correct in a controlled manner and find support in the $0.00850 to $0.00900 range.
- Take Profit 1: $0.00960
- Take Profit 2: $0.01020
- Stop Loss: $0.00790
✔️ Potential short entry: Watch for a rejection or loss of momentum if the price tries to reclaim the upper resistance zone between $0.01020 and $0.01050.
- Take Profit 1: $0.00940
- Take Profit 2: $0.00870
- Stop Loss: $0.01075
📌 Remember to always confirm volume behavior and candle structure on the 15-minute timeframe after any liquidity sweep or long wick, and always trade with prudent risk management.
What do you think of HUMA's current price action after this breather on the chart? Would you rather look for a bounce lower down or a short higher up?
✨ Follow me so you don't miss any analysis and can trade strategically!
Legal disclaimer: Educational content, not financial advice.
#AnalisisTecnico