What metric would you use to analyze this result?
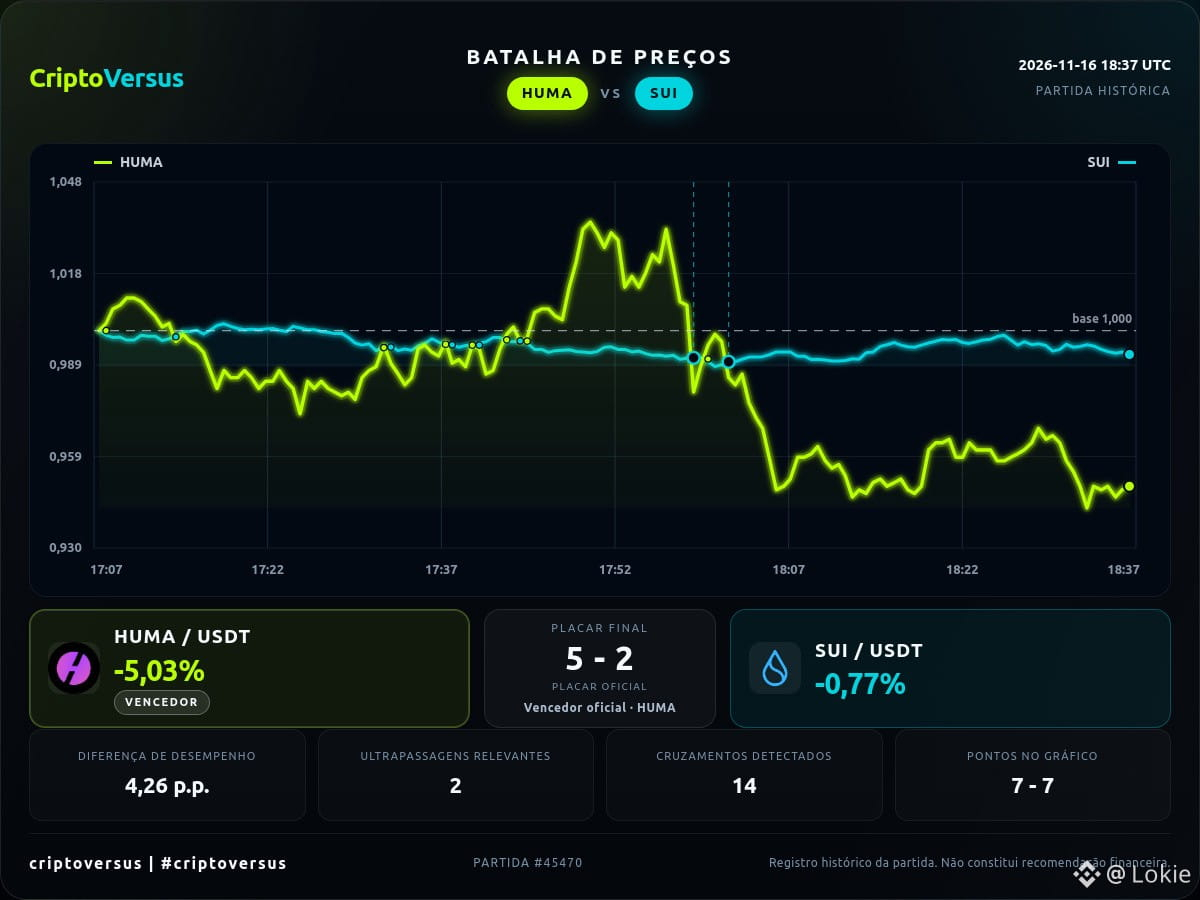
HUMA vs. SUI: the relative performance curves crossed 14 times, with the advantage alternating between the assets. HUMA: -5.0% | SUI: -0.8%. Difference of 4.3 percentage points in perform...
Here, the comparison is made over the same observation window.
Pairing: HUMA x SUI.
#CriptoVersus #PriceBattle #HUMA #SUI
Historical and informational content; not financial advice.
HUMA vs. SUI: the relative performance curves crossed 14 times, with the advantage alternating between the assets. HUMA: -5.0% | SUI: -0.8%. Difference of 4.3 percentage points in perform...
Here, the comparison is made over the same observation window.
Pairing: HUMA x SUI.
#CriptoVersus #PriceBattle #HUMA #SUI
Historical and informational content; not financial advice.