Options Map 16.11: Where the Market Is Holding BTC and ETH
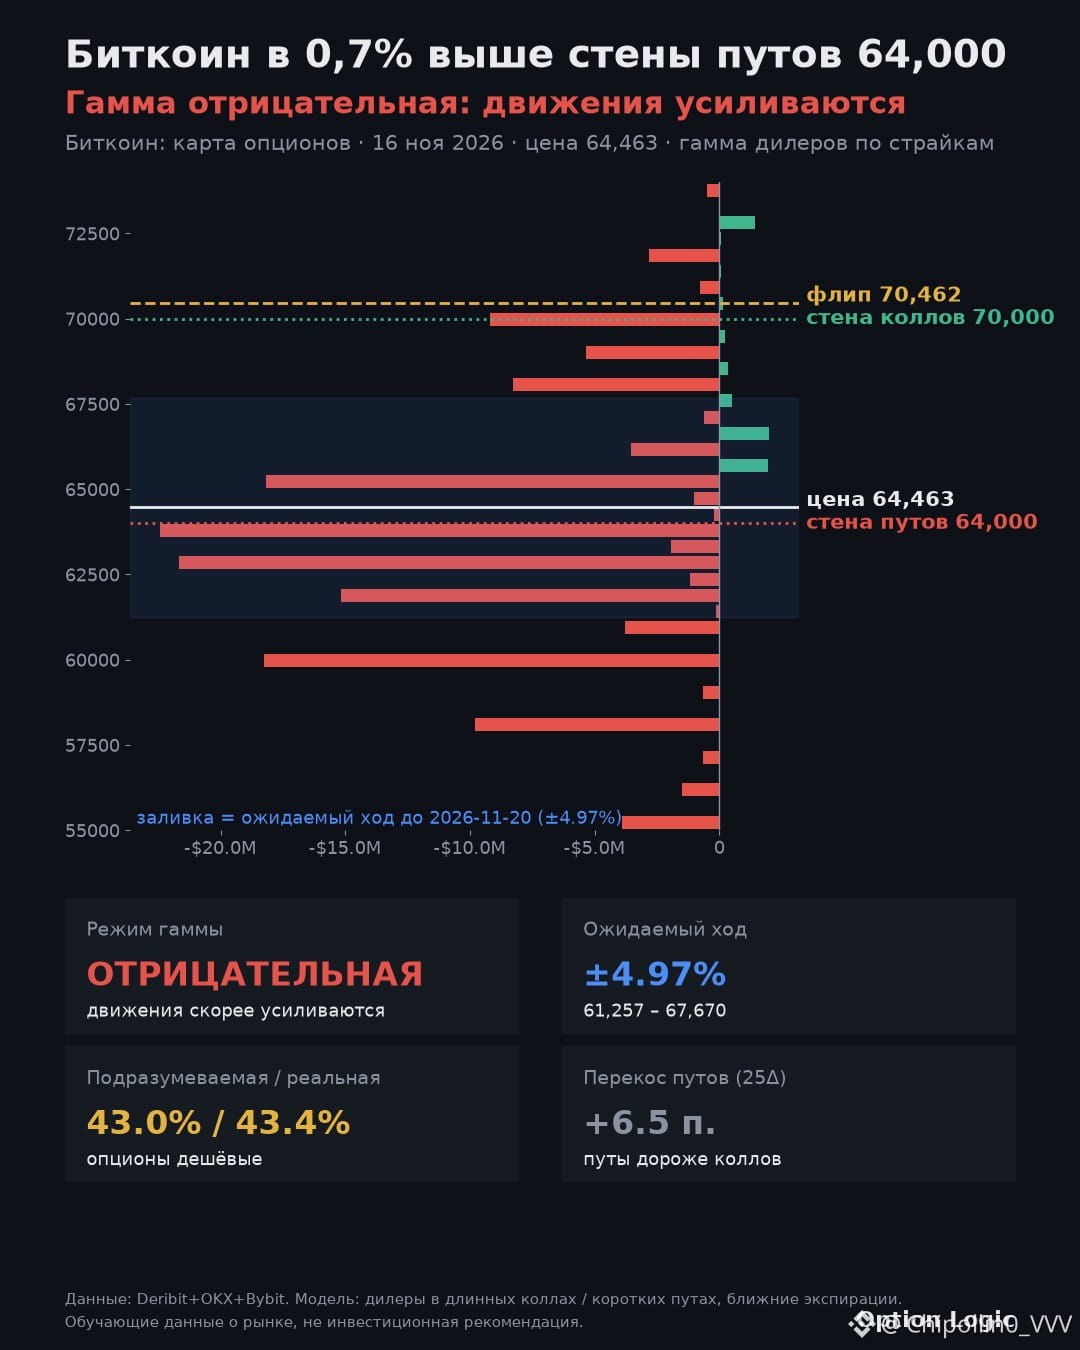
$BTC — Bitcoin is 0.7% above the 64,000 put wall
Negative gamma: moves are amplified
Levels: 64,000 put wall · flip 70,462 · 70,000 call wall
Expected move through 20.11: 61,257–67,670 (±4.97%)
How the map frames a directional trade:
• Upside: The 70,000 call wall and 70,462 flip are close together, forming a strong ceiling; holding above 70,462 changes the picture.
• Downside: A break below the 64,000 put wall usually accelerates in negative gamma; the map’s boundary is 61,257.
• Options are cheap: IV 43.0% versus realized volatility of 43.4%.
• Under the market’s hood: On OKX, there are 2.8 times more long accounts than short accounts.
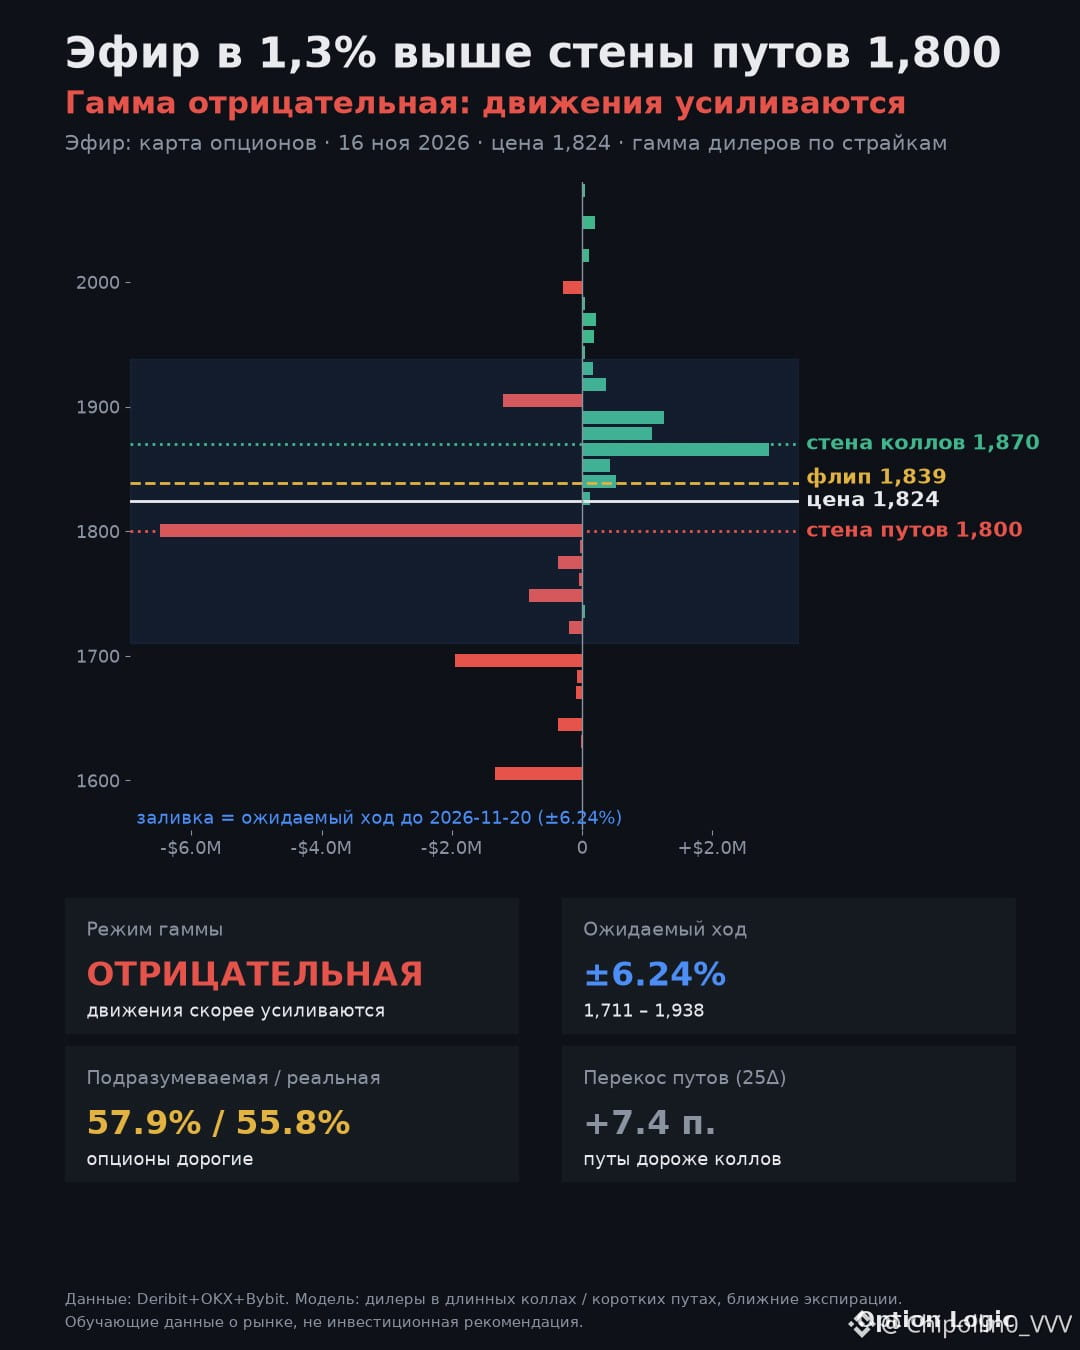
$ETH — Ether is 1.3% above the 1,800 put wall
Negative gamma: moves are amplified
Levels: 1,800 put wall · flip 1,839 · 1,870 call wall
Expected move through 20.11: 1,711–1,938 (±6.24%)
How the map frames a directional trade:
• Upside: First, price needs to reclaim the 1,839 flip—dealer hedging starts dampening moves there; the next magnet is 1,870.
• Downside: A break below the 1,800 put wall usually accelerates in negative gamma; the map’s boundary is 1,711.
• Options are expensive: IV 57.9% versus realized volatility of 55.8%.
Not investment advice — data on options market structure.
#BTC #ETH #опционы #OptionLogic
$BTC — Bitcoin is 0.7% above the 64,000 put wall
Negative gamma: moves are amplified
Levels: 64,000 put wall · flip 70,462 · 70,000 call wall
Expected move through 20.11: 61,257–67,670 (±4.97%)
How the map frames a directional trade:
• Upside: The 70,000 call wall and 70,462 flip are close together, forming a strong ceiling; holding above 70,462 changes the picture.
• Downside: A break below the 64,000 put wall usually accelerates in negative gamma; the map’s boundary is 61,257.
• Options are cheap: IV 43.0% versus realized volatility of 43.4%.
• Under the market’s hood: On OKX, there are 2.8 times more long accounts than short accounts.
$ETH — Ether is 1.3% above the 1,800 put wall
Negative gamma: moves are amplified
Levels: 1,800 put wall · flip 1,839 · 1,870 call wall
Expected move through 20.11: 1,711–1,938 (±6.24%)
How the map frames a directional trade:
• Upside: First, price needs to reclaim the 1,839 flip—dealer hedging starts dampening moves there; the next magnet is 1,870.
• Downside: A break below the 1,800 put wall usually accelerates in negative gamma; the map’s boundary is 1,711.
• Options are expensive: IV 57.9% versus realized volatility of 55.8%.
Not investment advice — data on options market structure.
#BTC #ETH #опционы #OptionLogic