
THE BEAR MARKET FLOOR.
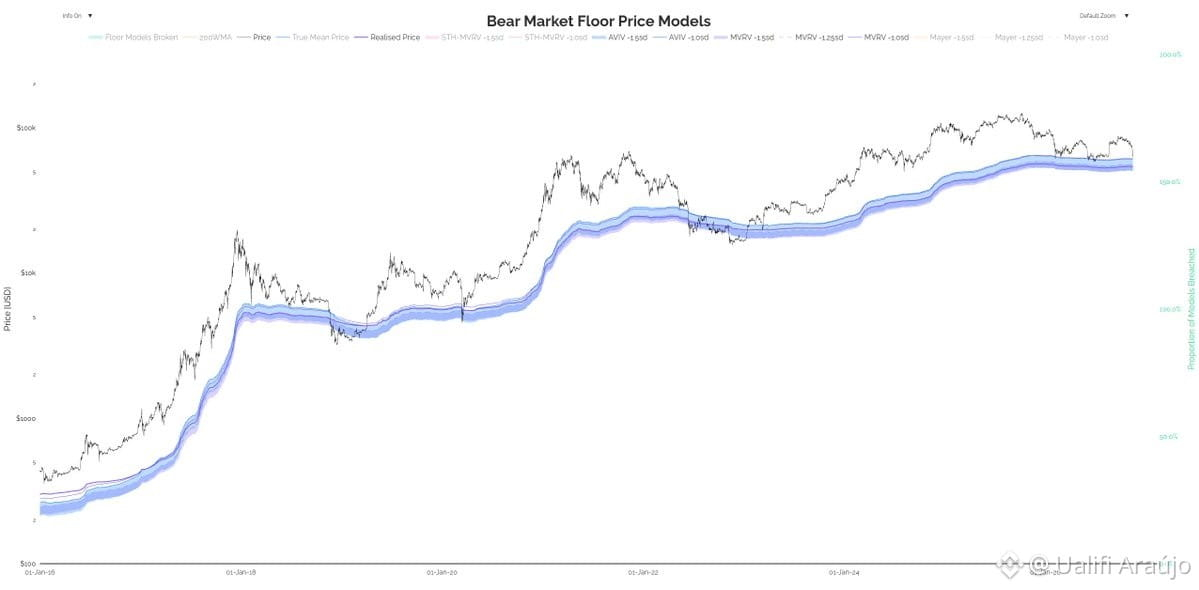
The Bear Market Floor Price Models chart is one of the most powerful tools for anyone thinking long term.
It brings together several classic on-chain models (Realised Price, True Mean Price, MVRV bands, Mayer Multiple, AVIV, and others) that have historically served as a FLOOR in bear markets.
What it clearly shows:
1) The floors aren’t static. They rise with each cycle.
2) Each correction finds support at higher levels than the previous one.
3) Even with the recent manipulation, the price of #BTC continues to trade above this cluster of support models.
This isn’t just a technical detail. It’s a sign that BTC is maturing: the accumulation base is becoming increasingly solid, long-term holders are raising their average cost, and the market is building new levels of resilience.
In previous cycles, when the price approached or tested these levels, that was exactly when major investors accumulated. Today, with the floors higher and the price still above them, the message is the same: the long-term bullish structure remains intact.
On-chain data shows that Bitcoin isn’t “going back to zero.” It’s building higher and stronger floors with every cycle.
For those accumulating with a long-term outlook, charts like this reinforce the thesis. The crypto market continues its secular trajectory.
The Bear Market Floor Price Models chart is one of the most powerful tools for anyone thinking long term.
It brings together several classic on-chain models (Realised Price, True Mean Price, MVRV bands, Mayer Multiple, AVIV, and others) that have historically served as a FLOOR in bear markets.
What it clearly shows:
1) The floors aren’t static. They rise with each cycle.
2) Each correction finds support at higher levels than the previous one.
3) Even with the recent manipulation, the price of #BTC continues to trade above this cluster of support models.
This isn’t just a technical detail. It’s a sign that BTC is maturing: the accumulation base is becoming increasingly solid, long-term holders are raising their average cost, and the market is building new levels of resilience.
In previous cycles, when the price approached or tested these levels, that was exactly when major investors accumulated. Today, with the floors higher and the price still above them, the message is the same: the long-term bullish structure remains intact.
On-chain data shows that Bitcoin isn’t “going back to zero.” It’s building higher and stronger floors with every cycle.
For those accumulating with a long-term outlook, charts like this reinforce the thesis. The crypto market continues its secular trajectory.