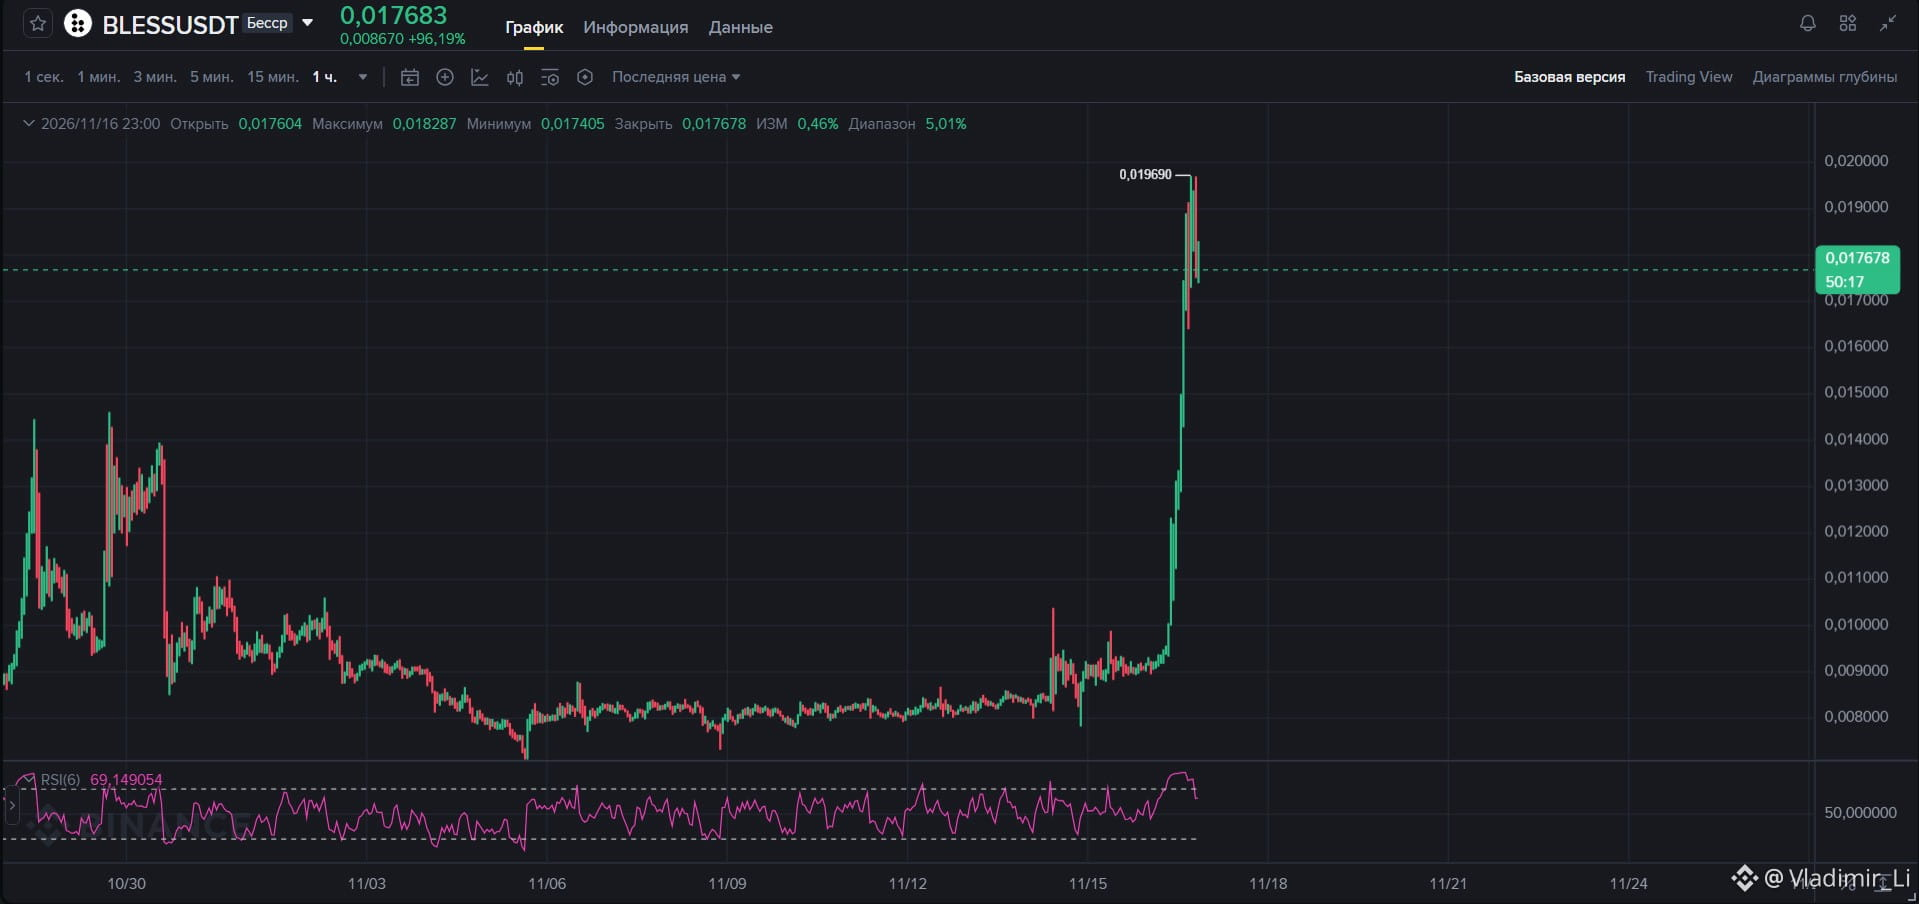
$BLESS hit the ceiling after a +96% pump — distribution is starting 📉
On the 1-hour chart, the coin made a vertical move from a base at 0.0090 to a peak of 0.019690. Now the momentum is fading: a long upper wick formed at the highs, RSI is cooling off from overbought territory (69.1), and buyers are starting to take profits.
Key chart levels (1h):
🔺 0.01969 — local high and key resistance. As long as the price stays below it, a correction is more likely.
🔻 0.01500–0.01550 — first support zone (the midpoint of the move, coinciding with the long liquidation shelf).
🔻 0.01350 — strong base where the final acceleration began.
Plan: jumping into a long after a rally like this is a sure way to become liquidity for a big player. We’ll wait for a healthy pullback to 0.0150 or 0.0135, and only then assess how buyers react. A break below 0.0170 would accelerate the correction.
Did you take profits on the move up, or are you waiting for a deep pullback to buy $BLESS ? Let us know in the comments 👇
#Bless #BLESSUSDT #BinanceFutures #cryptotrading
On the 1-hour chart, the coin made a vertical move from a base at 0.0090 to a peak of 0.019690. Now the momentum is fading: a long upper wick formed at the highs, RSI is cooling off from overbought territory (69.1), and buyers are starting to take profits.
Key chart levels (1h):
🔺 0.01969 — local high and key resistance. As long as the price stays below it, a correction is more likely.
🔻 0.01500–0.01550 — first support zone (the midpoint of the move, coinciding with the long liquidation shelf).
🔻 0.01350 — strong base where the final acceleration began.
Plan: jumping into a long after a rally like this is a sure way to become liquidity for a big player. We’ll wait for a healthy pullback to 0.0150 or 0.0135, and only then assess how buyers react. A break below 0.0170 would accelerate the correction.
Did you take profits on the move up, or are you waiting for a deep pullback to buy $BLESS ? Let us know in the comments 👇
#Bless #BLESSUSDT #BinanceFutures #cryptotrading