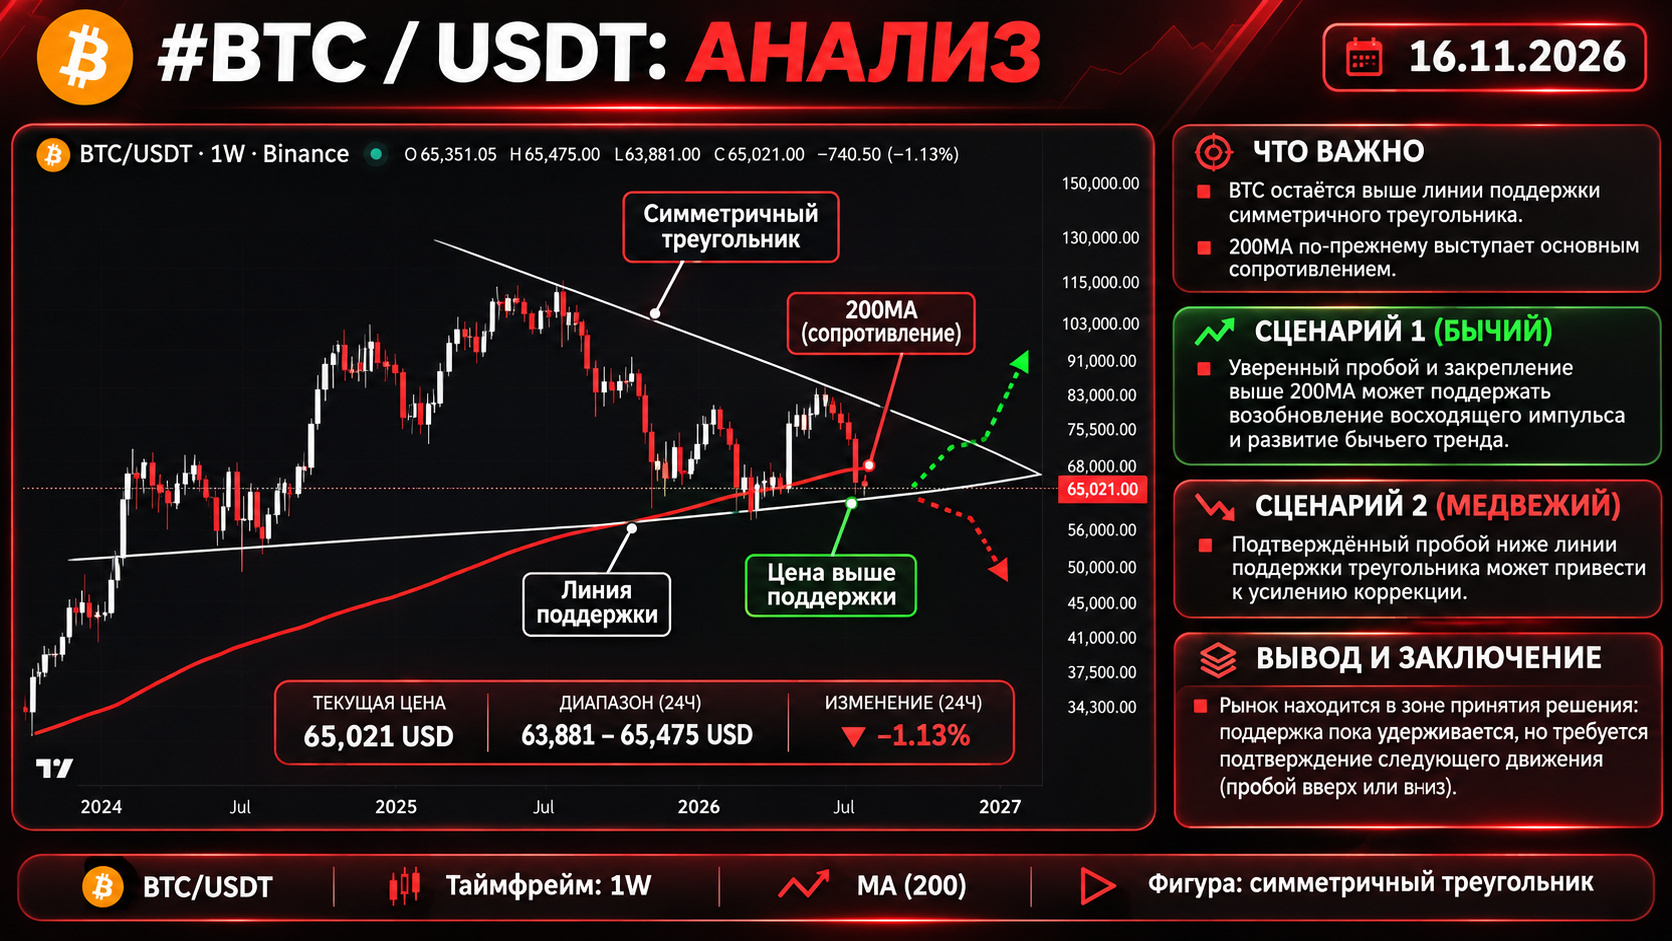
$BTC /USDT — scenario confirmation levels
16.11.2026 | 1W | Binance
The current price on Binance is $65,054. I checked the weekly candles and calculated the SMA200: approximately $68,200 on the current, still-open candle.
1. Bullish scenario — BTC recovery
• $68,000–68,200 — first resistance, the weekly SMA200.
• A weekly candle close above $68,200 — preliminary confirmation of a recovery.
• $75,500–77,000 — the approximate area of the triangle’s descending resistance line on your chart.
• A weekly close above the triangle’s upper line would confirm the stronger bullish scenario.
Important: breaking above the SMA200 does not yet mean the triangle itself has been broken.
2. Bearish scenario — further decline
• $63,905 — the current daily low and the nearest local level to watch.
• $62,006 — last week’s low. Losing this level would strengthen the bearish scenario.
• $60,000–61,000 — the approximate area of the triangle’s ascending support line.
• A weekly close below the lower line, followed by an unsuccessful retest, would confirm a breakdown from the pattern.
My conclusion
Intermediate range
$62,000–68,200
Below $62,000 — weakness. Above $68,200 — recovery
The bias remains bearish for now, as BTC is below the weekly SMA200 and continues to form lower highs.
Key takeaway: losing $62,006 would increase the risk of a decline toward the triangle’s support line. A move back above $68,200 would be the first sign of recovery. A full change in the weekly structure would require breaking above the pattern’s upper boundary.