$NVDA S&P 500 and Nasdaq futures hit quarterly lows 🔥
════════════════════
🟢 $NVDA S&P 500 and Nasdaq futures hit quarterly lows | Short-term bearish · Multi-timeframe confluence
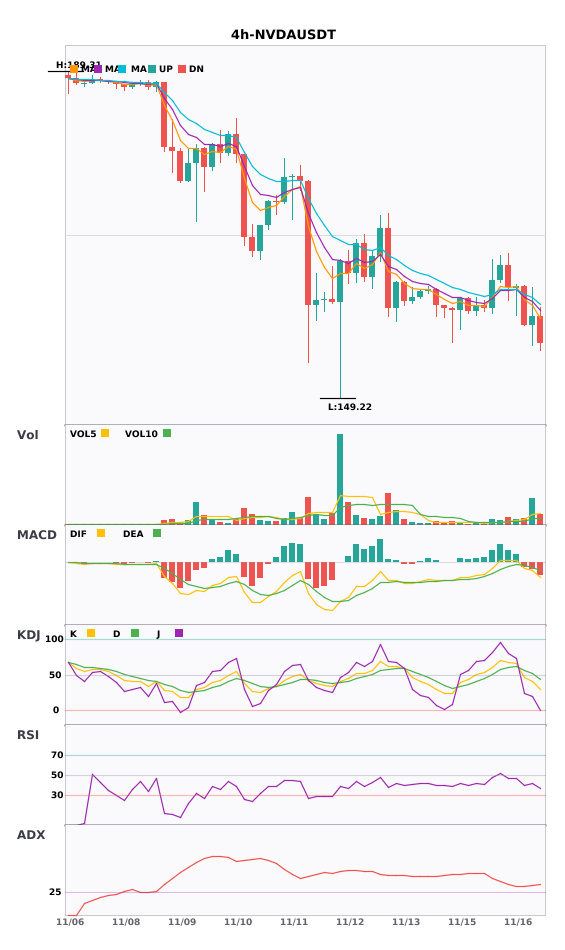
⚠️ Technical analysis: NVDA is currently at $156. The daily and 4-hour moving averages are all aligned bearishly, with both timeframes pointing in the same direction, creating a clear bearish confluence. The daily ADX is as high as 64.4, indicating an extremely strong downtrend. The 4-hour volume ratio is 1.08, with rising volume accompanying the decline. The MACD histogram is still expanding in negative territory, with the death cross widening, while the KDJ remains persistently subdued at low levels. Resistance at 220.61 is far overhead. Watch whether support at 149.22 holds; a break below it would open the door to further downside.
📢 Market update: S&P 500 and Nasdaq futures have both hit quarterly lows. Rising macro-driven risk aversion is weighing on tech stock valuations, and NVDA, as a semiconductor leader, is being significantly dragged down by the broader market. It has fallen nearly 6% over the past 24 hours, among the steepest declines. Short-term investors are showing strong panic-driven selling. Monitor the impact of macro factors such as Federal Reserve policy and tariffs on the semiconductor sector.
════════════════════
🔔 Follow for first-hand market updates 🔔
#技术分析 #多周期共振 #标普500与纳指期货创季度新低 #NVDA
📌 When trading, pay attention to whether the candlestick patterns align
════════════════════
🟢 $NVDA S&P 500 and Nasdaq futures hit quarterly lows | Short-term bearish · Multi-timeframe confluence
⚠️ Technical analysis: NVDA is currently at $156. The daily and 4-hour moving averages are all aligned bearishly, with both timeframes pointing in the same direction, creating a clear bearish confluence. The daily ADX is as high as 64.4, indicating an extremely strong downtrend. The 4-hour volume ratio is 1.08, with rising volume accompanying the decline. The MACD histogram is still expanding in negative territory, with the death cross widening, while the KDJ remains persistently subdued at low levels. Resistance at 220.61 is far overhead. Watch whether support at 149.22 holds; a break below it would open the door to further downside.
📢 Market update: S&P 500 and Nasdaq futures have both hit quarterly lows. Rising macro-driven risk aversion is weighing on tech stock valuations, and NVDA, as a semiconductor leader, is being significantly dragged down by the broader market. It has fallen nearly 6% over the past 24 hours, among the steepest declines. Short-term investors are showing strong panic-driven selling. Monitor the impact of macro factors such as Federal Reserve policy and tariffs on the semiconductor sector.
════════════════════
🔔 Follow for first-hand market updates 🔔
#技术分析 #多周期共振 #标普500与纳指期货创季度新低 #NVDA
📌 When trading, pay attention to whether the candlestick patterns align