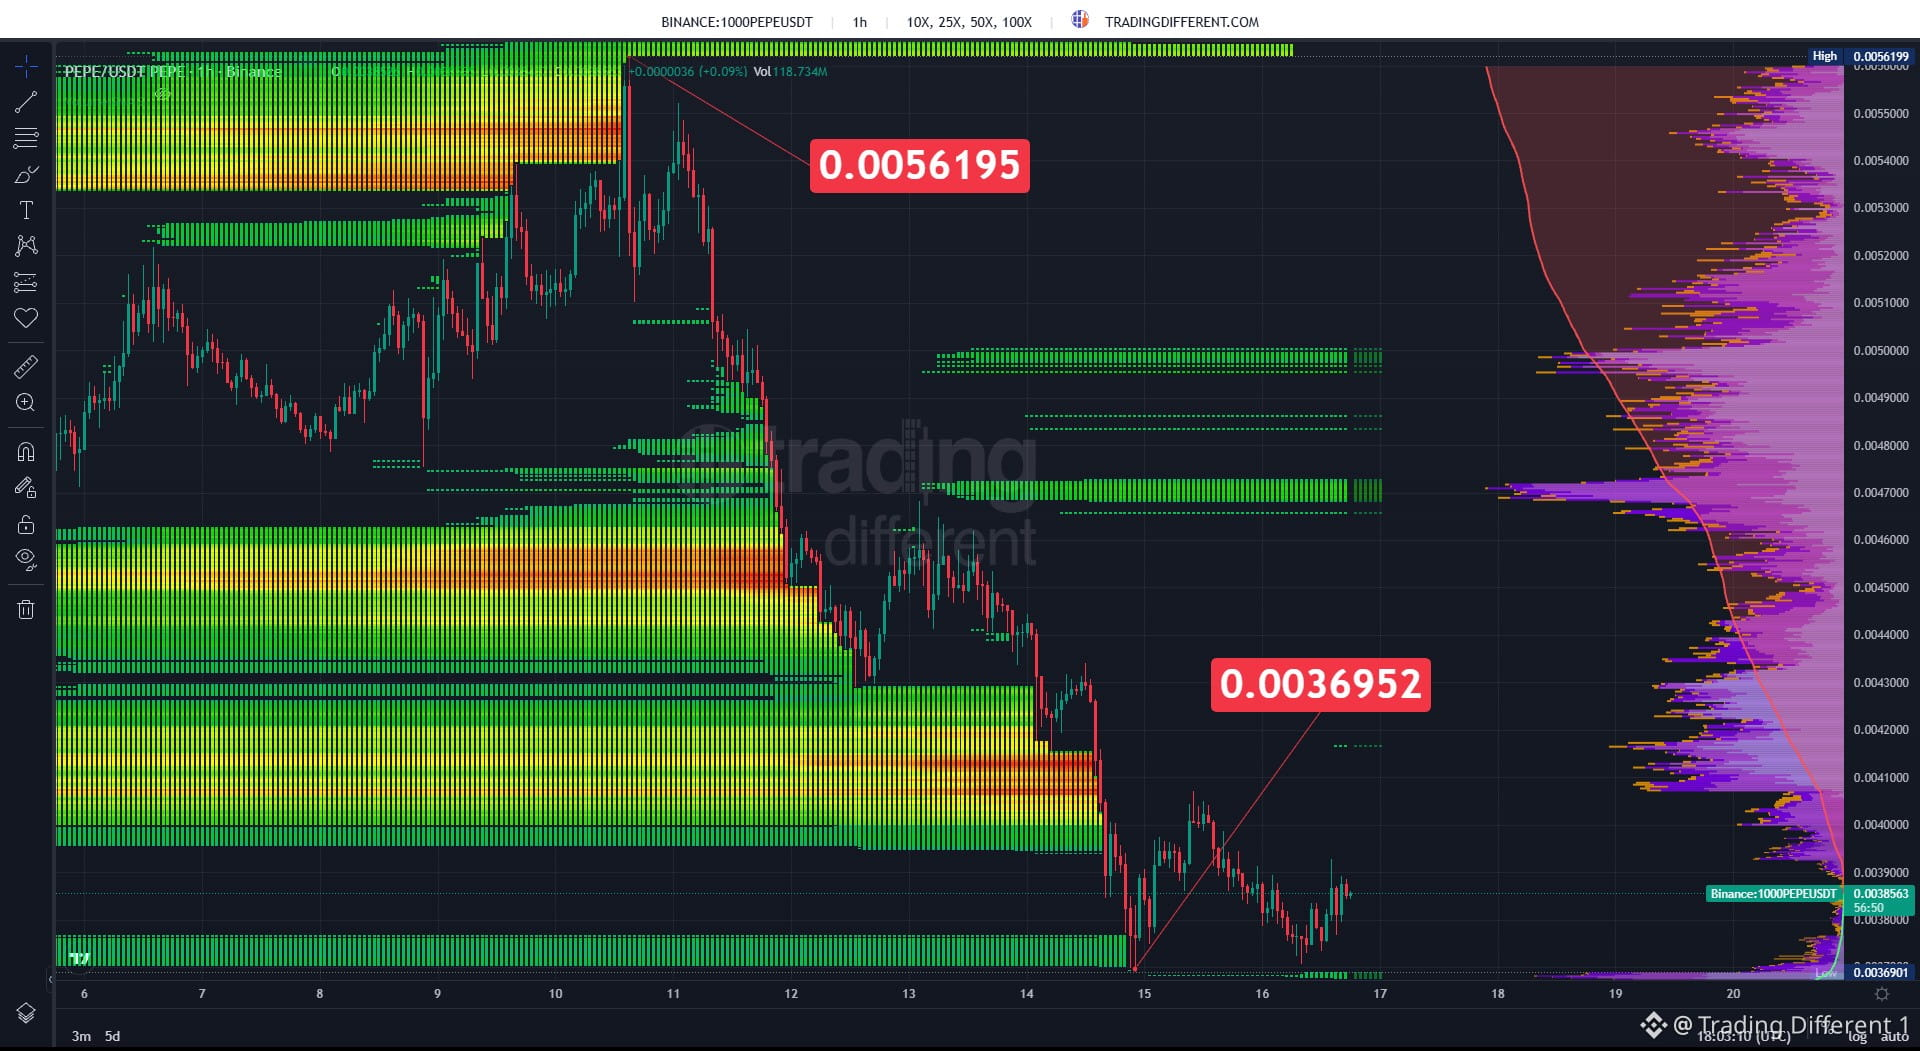
$PEPE | PEPE swept through the two largest long liquidation clusters on the map
On the 1-hour chart for the 1000PEPE contract, across all leverage levels, PEPE fell from a high of 0.0056199 and first swept the long liquidation cluster between 0.0046 and 0.0043, then the next one, between 0.0043 and 0.0040. The low was 0.0036901, and it is now trading at 0.0038563.
Only a few long positions remain below the price, near 0.0037. Above, there is a thin band of short positions near 0.0042, while the largest clusters are at 0.0047, about 22% higher, and between 0.0049 and 0.0050.
The map does not indicate the direction of the price. It shows where leveraged positions would be forcibly liquidated if the price reaches those levels.
$PEPE #Liquidations #Trading
On the 1-hour chart for the 1000PEPE contract, across all leverage levels, PEPE fell from a high of 0.0056199 and first swept the long liquidation cluster between 0.0046 and 0.0043, then the next one, between 0.0043 and 0.0040. The low was 0.0036901, and it is now trading at 0.0038563.
Only a few long positions remain below the price, near 0.0037. Above, there is a thin band of short positions near 0.0042, while the largest clusters are at 0.0047, about 22% higher, and between 0.0049 and 0.0050.
The map does not indicate the direction of the price. It shows where leveraged positions would be forcibly liquidated if the price reaches those levels.
$PEPE #Liquidations #Trading