$ICP 🚀 ( ICP/USDT is on the move!
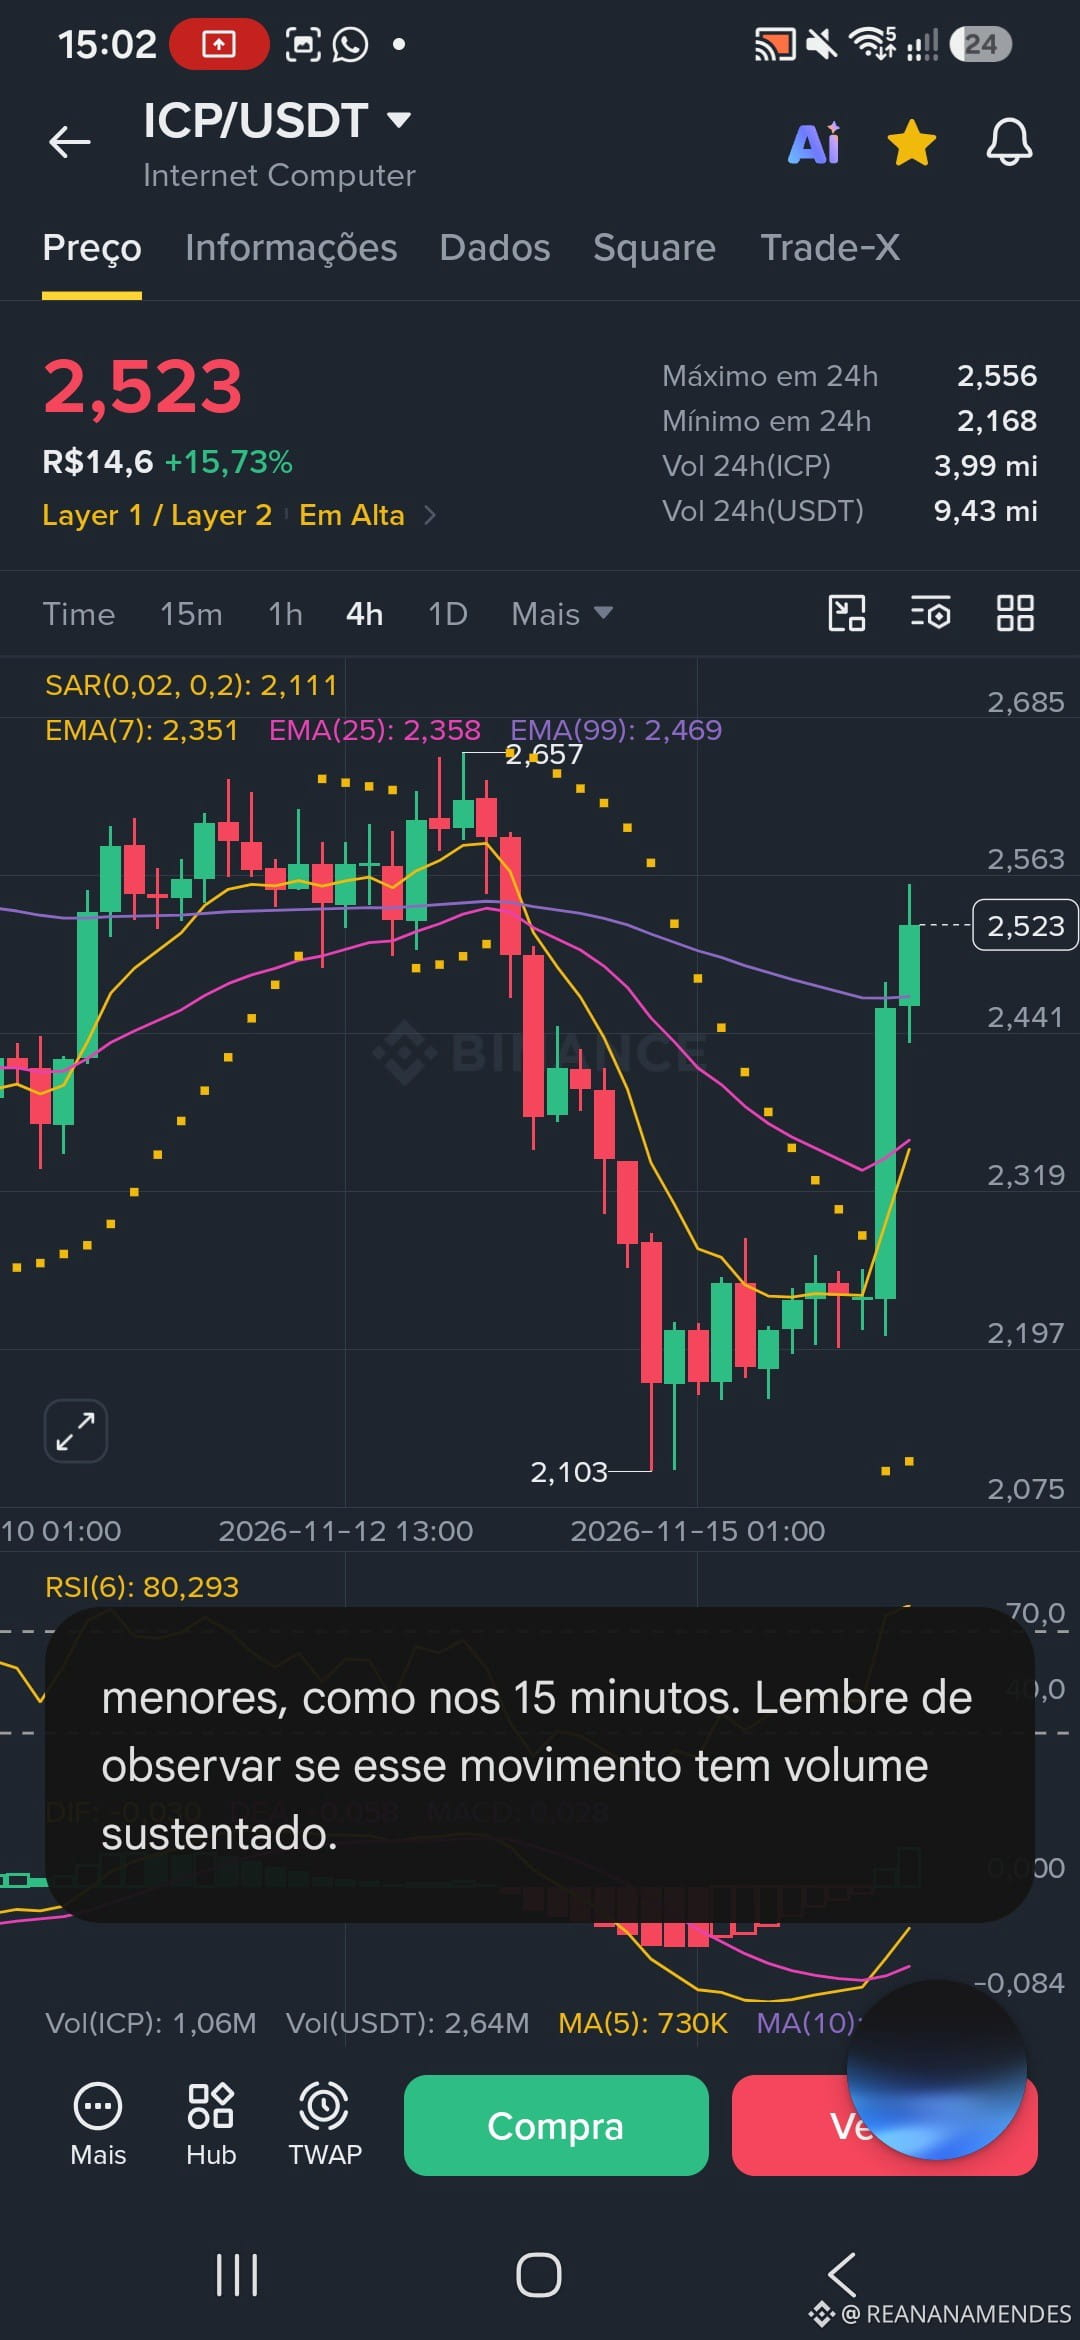
Keeping an eye on the ICP chart! The asset has been showing strength over the past few hours, riding a +15.73% gain and trading around $2.52 (R$ 14.60). But as every good trader knows, there’s more to it than meets the eye when the price surges quickly.
📊 What the indicators are showing:
Higher Timeframes (1h / 4h): The MACD remains positive, and the histogram and moving averages (EMA 7, 25, and 99) are pointing upward, supporting the broader recovery trend after the low around $2.10.
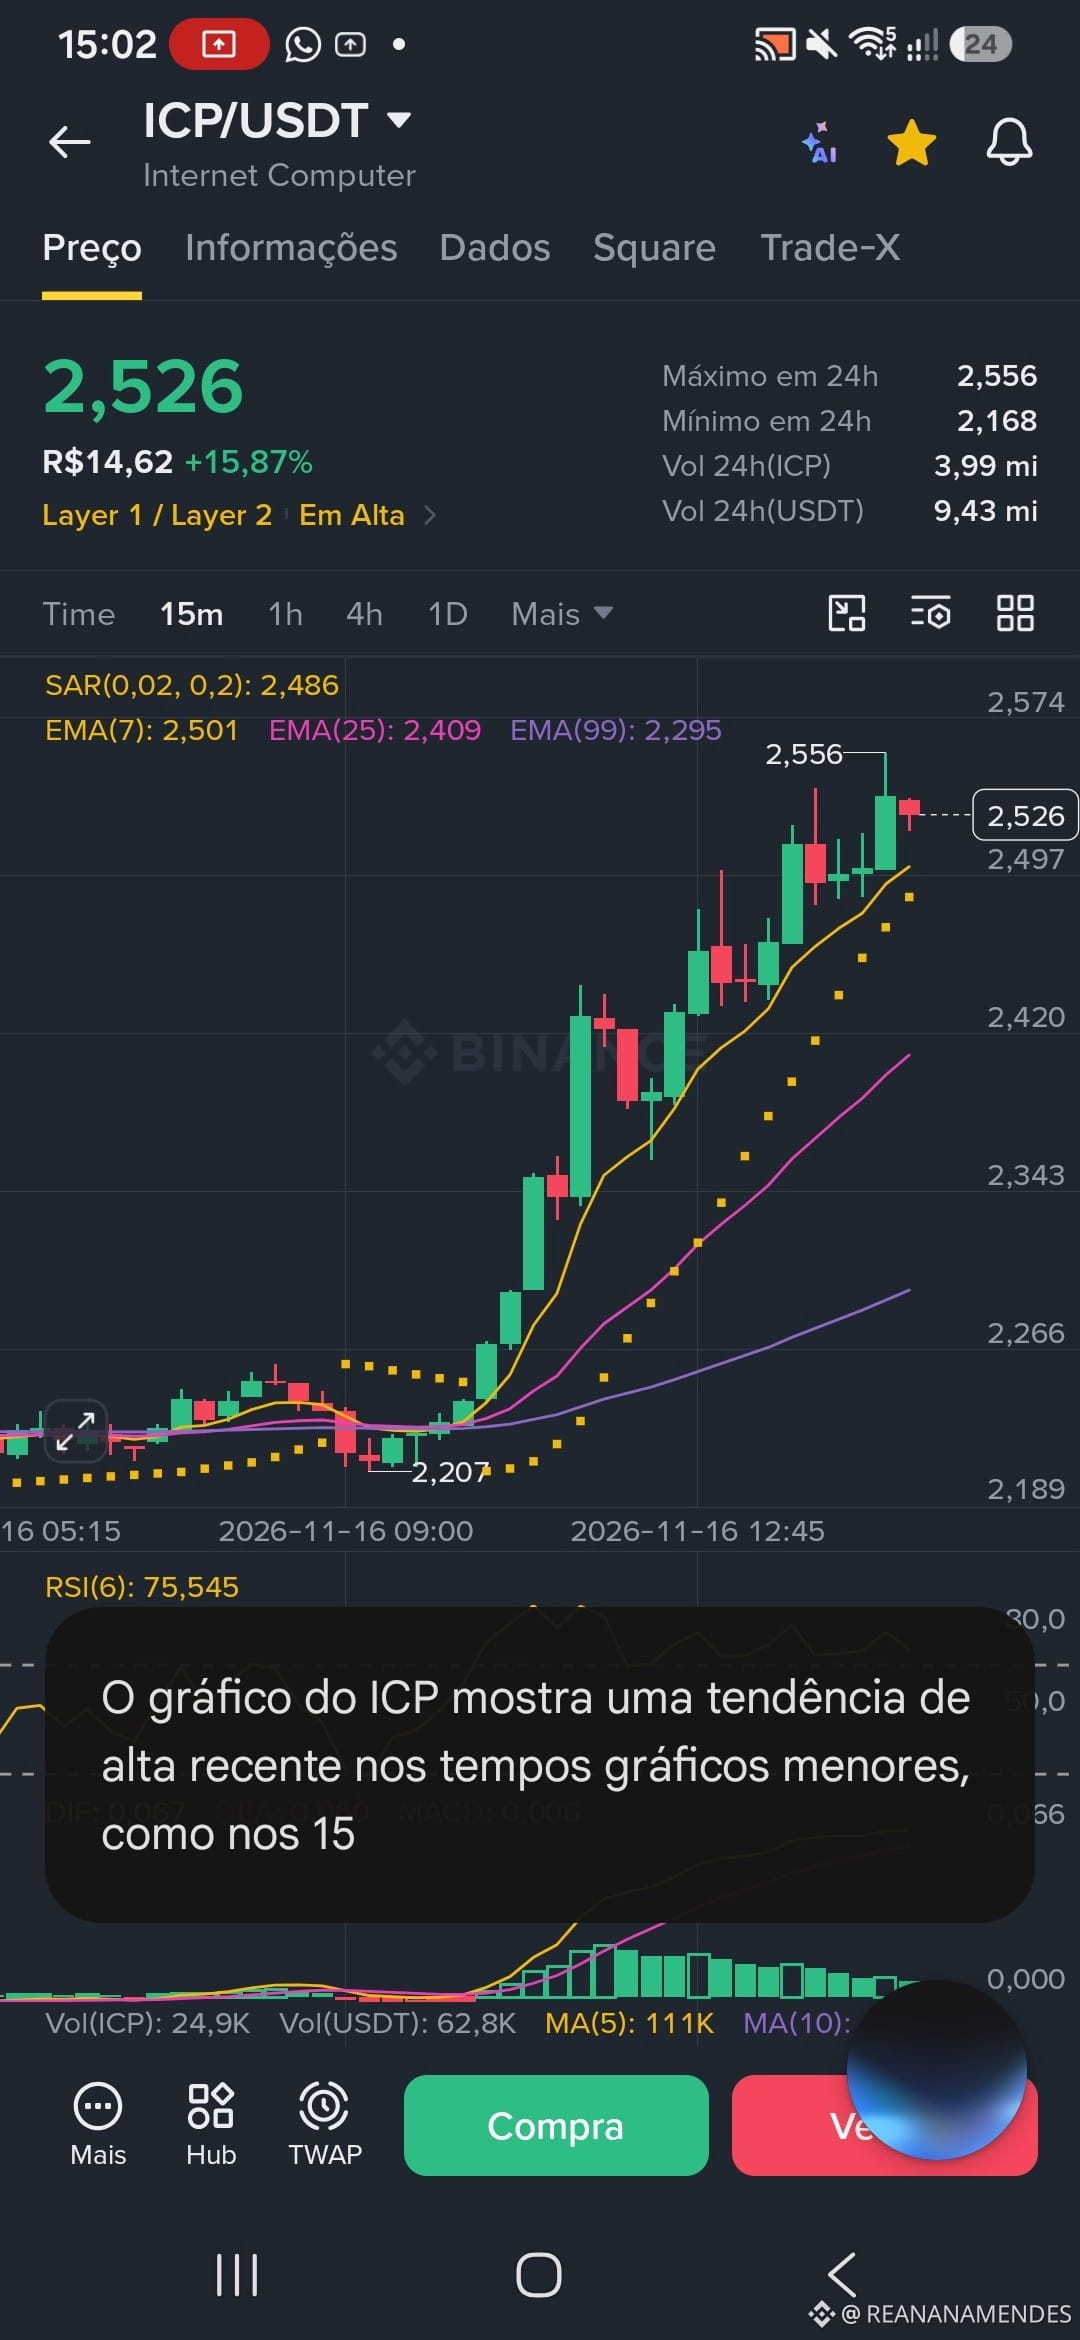
Lower Timeframes (15m): Beware of the euphoria! The RSI(6) hitting 80 is already signaling an overbought zone. The Parabolic SAR remains positioned above, and the DIF/DEA crossover on the lower timeframes shows signs of a pullback, with the histogram losing strength.
🤔Tactical view: This is a time for caution if you're thinking of chasing the move at the last minute (FOMO). Ideally, wait for a breather, monitor whether buying volume holds up during pullbacks, or look for confirmation at support levels before opening new positions. Risk management always comes first — keep an eye on your Stop Loss! 🛡️📉
So, trader? Buying this rally or waiting for a correction? Share your take in the comments! 👇🔥
#ICP #BinanceSquare
Keeping an eye on the ICP chart! The asset has been showing strength over the past few hours, riding a +15.73% gain and trading around $2.52 (R$ 14.60). But as every good trader knows, there’s more to it than meets the eye when the price surges quickly.
📊 What the indicators are showing:
Higher Timeframes (1h / 4h): The MACD remains positive, and the histogram and moving averages (EMA 7, 25, and 99) are pointing upward, supporting the broader recovery trend after the low around $2.10.
Lower Timeframes (15m): Beware of the euphoria! The RSI(6) hitting 80 is already signaling an overbought zone. The Parabolic SAR remains positioned above, and the DIF/DEA crossover on the lower timeframes shows signs of a pullback, with the histogram losing strength.
🤔Tactical view: This is a time for caution if you're thinking of chasing the move at the last minute (FOMO). Ideally, wait for a breather, monitor whether buying volume holds up during pullbacks, or look for confirmation at support levels before opening new positions. Risk management always comes first — keep an eye on your Stop Loss! 🛡️📉
So, trader? Buying this rally or waiting for a correction? Share your take in the comments! 👇🔥
#ICP #BinanceSquare