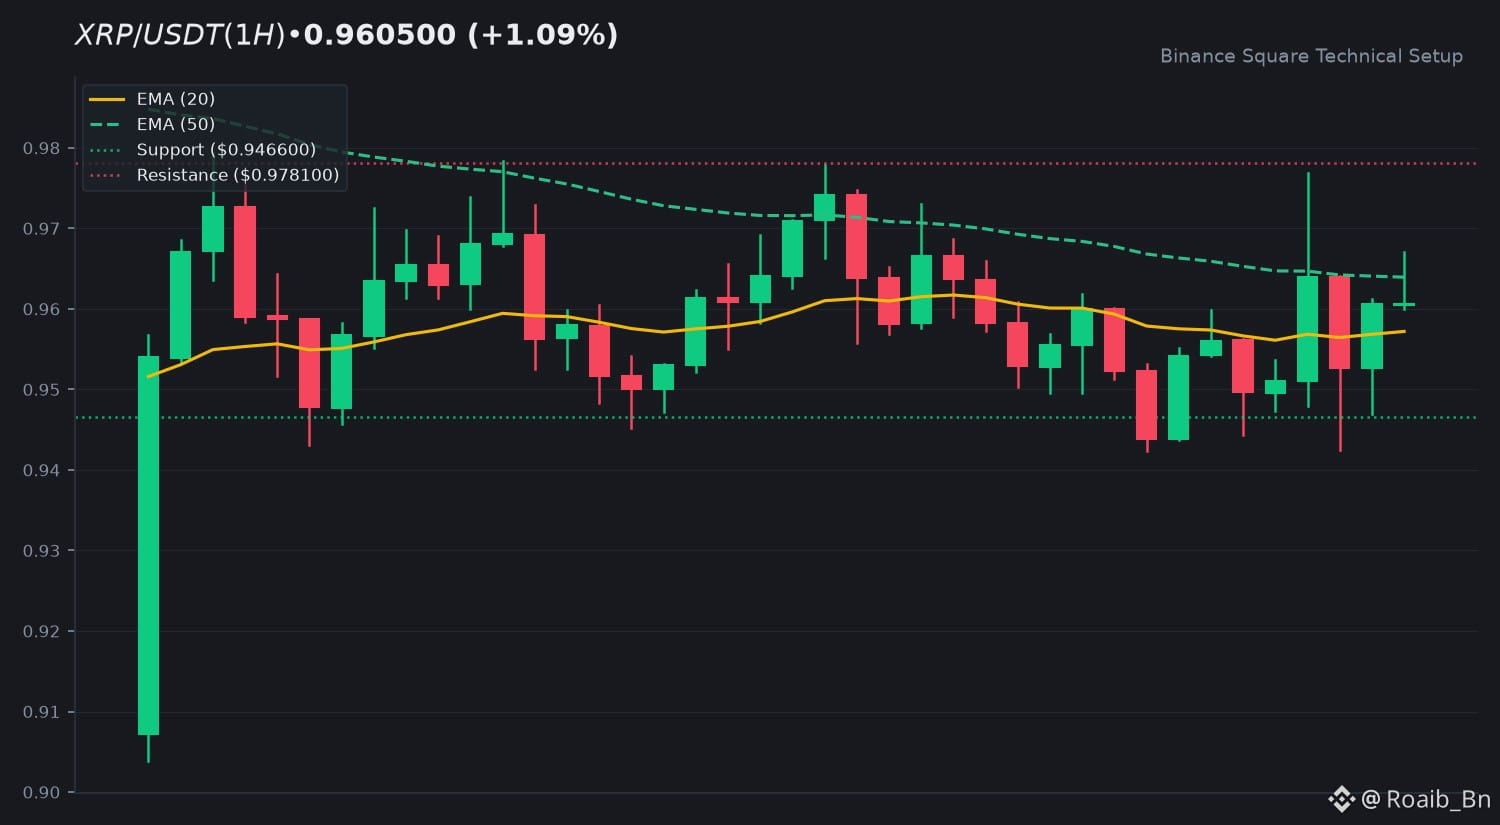
🔥 $XRP Technical Update: Key Levels & Momentum Breakdown
📊 1. Market Snapshot
$XRP is currently trading at $0.9605, reflecting a modest 24-hour gain of +1.09 percent. Price action moved within a daily range between a low of $0.9424 and a high of $0.9779. Total 24-hour quote volume stands at $115,562,220 USDT, accompanied by a low volume ratio of 0.4x relative to the 20-period simple moving average, indicating ongoing consolidation with lower market conviction.
📈 2. Technical Momentum & Indicator Bias
Price is consolidating between the EMA 20 at $0.9572 and the EMA 50 at $0.9639, pointing toward a short-term equilibrium state. The Relative Strength Index sits at 51.66, reflecting a completely neutral market momentum state without overbought or oversold extremes. Meanwhile, the MACD histogram prints a minor positive reading at +0.0007, while the MACD line (-0.0009) and signal line (-0.0015) remain closely aligned near the zero line, signaling an ongoing trend reversal and stabilization attempt.
🎯 3. Key Technical Levels to Watch
• 🟢 Resistance Zone: Immediate resistance is located around $0.9781, with a secondary extension level sitting at $0.9983.
• 🔴 Support Zone: The primary support floor rests at $0.9466, backed by a deeper technical support level at $0.8930.
• 🛡️ Pivot Confluence: The EMA 50 at $0.9639 acts as a crucial dynamic pivot line for short-term direction.
💡 4. Technical Takeaway & Risk Management
Traders are monitoring how price behaves around the overlapping EMA zones. Sustained volume expansion above the EMA 50 could
📊 1. Market Snapshot
$XRP is currently trading at $0.9605, reflecting a modest 24-hour gain of +1.09 percent. Price action moved within a daily range between a low of $0.9424 and a high of $0.9779. Total 24-hour quote volume stands at $115,562,220 USDT, accompanied by a low volume ratio of 0.4x relative to the 20-period simple moving average, indicating ongoing consolidation with lower market conviction.
📈 2. Technical Momentum & Indicator Bias
Price is consolidating between the EMA 20 at $0.9572 and the EMA 50 at $0.9639, pointing toward a short-term equilibrium state. The Relative Strength Index sits at 51.66, reflecting a completely neutral market momentum state without overbought or oversold extremes. Meanwhile, the MACD histogram prints a minor positive reading at +0.0007, while the MACD line (-0.0009) and signal line (-0.0015) remain closely aligned near the zero line, signaling an ongoing trend reversal and stabilization attempt.
🎯 3. Key Technical Levels to Watch
• 🟢 Resistance Zone: Immediate resistance is located around $0.9781, with a secondary extension level sitting at $0.9983.
• 🔴 Support Zone: The primary support floor rests at $0.9466, backed by a deeper technical support level at $0.8930.
• 🛡️ Pivot Confluence: The EMA 50 at $0.9639 acts as a crucial dynamic pivot line for short-term direction.
💡 4. Technical Takeaway & Risk Management
Traders are monitoring how price behaves around the overlapping EMA zones. Sustained volume expansion above the EMA 50 could