$BTC Crypto Academician: 11.17 Bitcoin (BTC) Bounce Trap in a Downtrend: Why It Cannot Reclaim the Moving Averages and Why the Rebound Should Be Treated Only as a Correction
To begin, spot positions can still be built in the first step; the second step is the 55,000 level. When the trend is downward, it is easiest to make two mistakes: first, thinking “it’s hit bottom” after a small drop and repeatedly getting caught while trying to buy the dip; second, thinking “the trend has reversed” after a small rebound and chasing price into resistance. The daily chart is bearish, while the four-hour chart is deeply oversold. Essentially, this is a corrective window within a weak market, not confirmation of a trend reversal. Risk management must always come before directional calls. A stop-loss is not a nuisance; it preserves your chance to enter again. The market never lacks opportunities—the challenge is keeping your capital intact long enough to seize them.
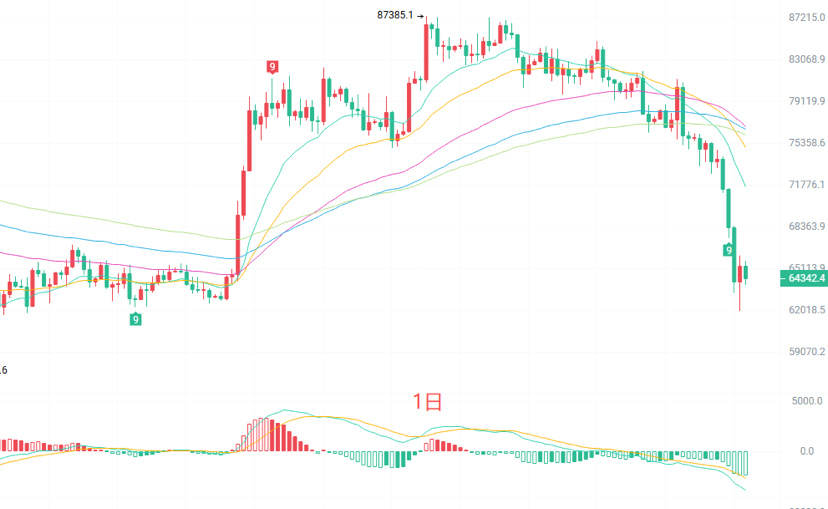
The daily candlestick chart has broken below all the short-, medium-, and long-term moving averages, which are now all above the price—a typical bearish alignment. The MACD lines are running below the zero line, and the green histogram bars are still expanding, so bearish momentum on the daily chart has not fully exhausted itself. The Bollinger Bands are opening downward, with price hugging the lower band at 64470 and the middle band at 74320 acting as distant resistance. Overall, the daily chart remains in a downtrend. Although the price is oversold near the lower band, until it climbs back above the moving averages and the middle band, any rebound should mainly be treated as a correction; avoid blindly buying the dip.
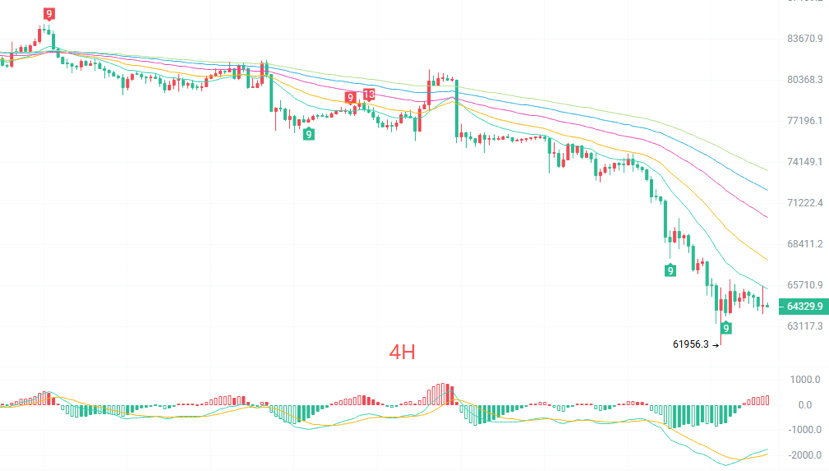
The four-hour candlestick chart is below all short- and medium-term moving averages. Any short-term rebound will first face the combined resistance of the EMA15 and the Bollinger middle band at 66008. Below the MACD zero line, the green histogram bars have contracted noticeably and are even showing slight signs of turning red. This indicates that selling momentum has weakened after the sustained decline, and that a short-term oversold correction may be due. The Bollinger lower band at 62652 and this round’s low at 61956 provide reference support below. Structurally, the four-hour chart remains in weak consolidation after the decline. The strength of the rebound will determine whether price forms a continuation base or stages a more substantial retracement. Watch whether the 65658–66008 resistance zone can be broken with increased volume.
Short-term reference:
Short: 66000–66500 if momentum stalls; stop-loss 500 points; targets 65000–64300, then 63000 if support breaks.
Long: 62500–62000 if the decline stalls; stop-loss 500 points; target 63500–84500.
For specific trades, prioritize real-time order-book data. For more information, please contact the author. This article may be published with a delay and is for reference only; assume all risks yourself.
#BTC走势分析 #BTC Futures
To begin, spot positions can still be built in the first step; the second step is the 55,000 level. When the trend is downward, it is easiest to make two mistakes: first, thinking “it’s hit bottom” after a small drop and repeatedly getting caught while trying to buy the dip; second, thinking “the trend has reversed” after a small rebound and chasing price into resistance. The daily chart is bearish, while the four-hour chart is deeply oversold. Essentially, this is a corrective window within a weak market, not confirmation of a trend reversal. Risk management must always come before directional calls. A stop-loss is not a nuisance; it preserves your chance to enter again. The market never lacks opportunities—the challenge is keeping your capital intact long enough to seize them.
The daily candlestick chart has broken below all the short-, medium-, and long-term moving averages, which are now all above the price—a typical bearish alignment. The MACD lines are running below the zero line, and the green histogram bars are still expanding, so bearish momentum on the daily chart has not fully exhausted itself. The Bollinger Bands are opening downward, with price hugging the lower band at 64470 and the middle band at 74320 acting as distant resistance. Overall, the daily chart remains in a downtrend. Although the price is oversold near the lower band, until it climbs back above the moving averages and the middle band, any rebound should mainly be treated as a correction; avoid blindly buying the dip.
The four-hour candlestick chart is below all short- and medium-term moving averages. Any short-term rebound will first face the combined resistance of the EMA15 and the Bollinger middle band at 66008. Below the MACD zero line, the green histogram bars have contracted noticeably and are even showing slight signs of turning red. This indicates that selling momentum has weakened after the sustained decline, and that a short-term oversold correction may be due. The Bollinger lower band at 62652 and this round’s low at 61956 provide reference support below. Structurally, the four-hour chart remains in weak consolidation after the decline. The strength of the rebound will determine whether price forms a continuation base or stages a more substantial retracement. Watch whether the 65658–66008 resistance zone can be broken with increased volume.
Short-term reference:
Short: 66000–66500 if momentum stalls; stop-loss 500 points; targets 65000–64300, then 63000 if support breaks.
Long: 62500–62000 if the decline stalls; stop-loss 500 points; target 63500–84500.
For specific trades, prioritize real-time order-book data. For more information, please contact the author. This article may be published with a delay and is for reference only; assume all risks yourself.
#BTC走势分析 #BTC Futures