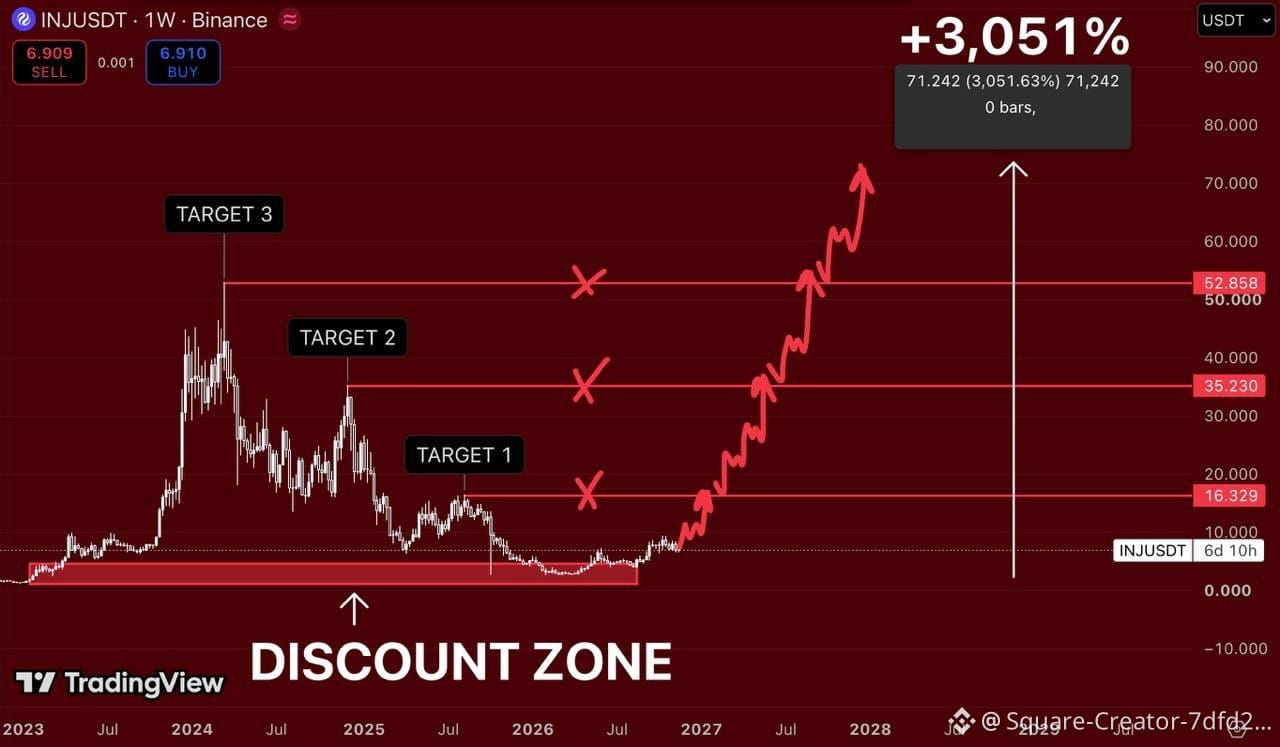
$INJ is trading at around $6.91.
After reaching $$INJ 50 in 2024, it spent years in correction before returning to its historical discount zone.
The weekly chart now shows a potential recovery setup.
What is the expected upside? +3,051% from the defined historical base.
My targets:
$16.329 - Target 1
$35.230 - Target 2
$52.858 - Target 3
$75 and above — extreme bullish scenario.
First, buyers need to reclaim $10 and achieve higher lows on the weekly chart.
After reaching $$INJ 50 in 2024, it spent years in correction before returning to its historical discount zone.
The weekly chart now shows a potential recovery setup.
What is the expected upside? +3,051% from the defined historical base.
My targets:
$16.329 - Target 1
$35.230 - Target 2
$52.858 - Target 3
$75 and above — extreme bullish scenario.
First, buyers need to reclaim $10 and achieve higher lows on the weekly chart.