Why compare GLMR and NEAR over the same period?
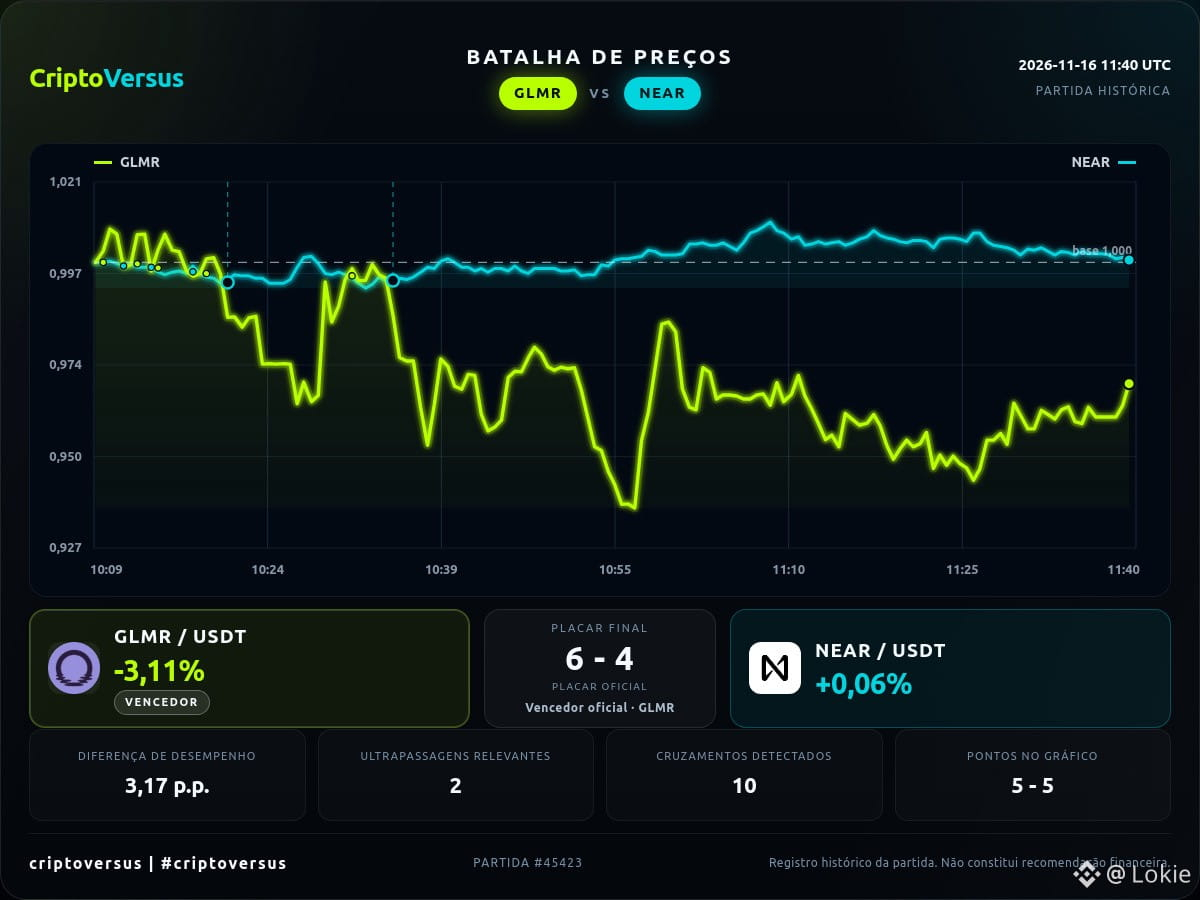
In the completed period: GLMR vs. NEAR: the relative performance curves crossed 10 times, with the advantage alternating between the assets. GLMR: -3.1% | NEAR: +0.1%. A difference of 3.2 percentage points in the...
The chart helps distinguish shifts in position from isolated fluctuations.
Would you have noticed this difference by following along live?
#CriptoVersus #PriceBattle #GLMR #NEAR
Historical and informational content; not financial advice.
In the completed period: GLMR vs. NEAR: the relative performance curves crossed 10 times, with the advantage alternating between the assets. GLMR: -3.1% | NEAR: +0.1%. A difference of 3.2 percentage points in the...
The chart helps distinguish shifts in position from isolated fluctuations.
Would you have noticed this difference by following along live?
#CriptoVersus #PriceBattle #GLMR #NEAR
Historical and informational content; not financial advice.