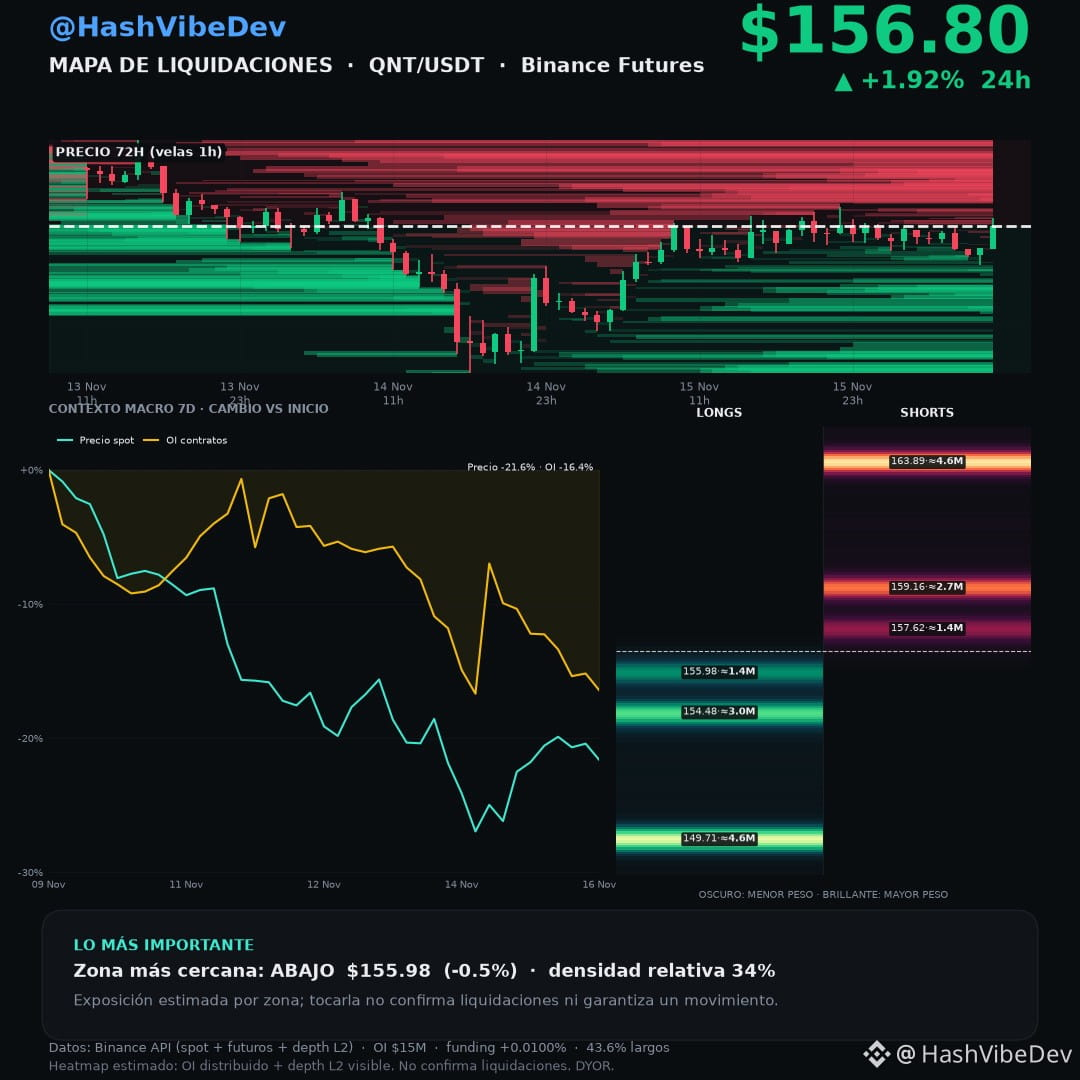
We closed the QNT short before the rebound that crossed the estimated short exposure zone. The closing card (Nov 14, 17:32:07) shows +118.01%, an entry price of 189.061111, and a last displayed price of 145.980000. QNT still fell to $138.89, then climbed above $157.62 (Nov 15, 19:40 UTC) and hit $159.12 (Nov 16, 02:25 UTC), $0.04 below $159.16. The exit preceded that rebound, though it was not the absolute low.
At 14:41 UTC today, QNT was trading at $156.80 (+1.92% over 24 hours). Over 24 hours, contract OI fell 2.5%; over 7 days, the price fell 21.6% and OI fell 16.4%. The taker buy/sell ratio was 0.93 over 24 hours and 0.96 in the latest reading. The map indicates estimated short exposure near $157.62; it does not confirm executed liquidations.
Will it recover $157.62 or return to $155.98? Follow the series.
#QNT $QNT
Not financial advice. DYOR.
At 14:41 UTC today, QNT was trading at $156.80 (+1.92% over 24 hours). Over 24 hours, contract OI fell 2.5%; over 7 days, the price fell 21.6% and OI fell 16.4%. The taker buy/sell ratio was 0.93 over 24 hours and 0.96 in the latest reading. The map indicates estimated short exposure near $157.62; it does not confirm executed liquidations.
Will it recover $157.62 or return to $155.98? Follow the series.
#QNT $QNT
Not financial advice. DYOR.