🚀 $RAY Could Be Preparing for a Massive Comeback!
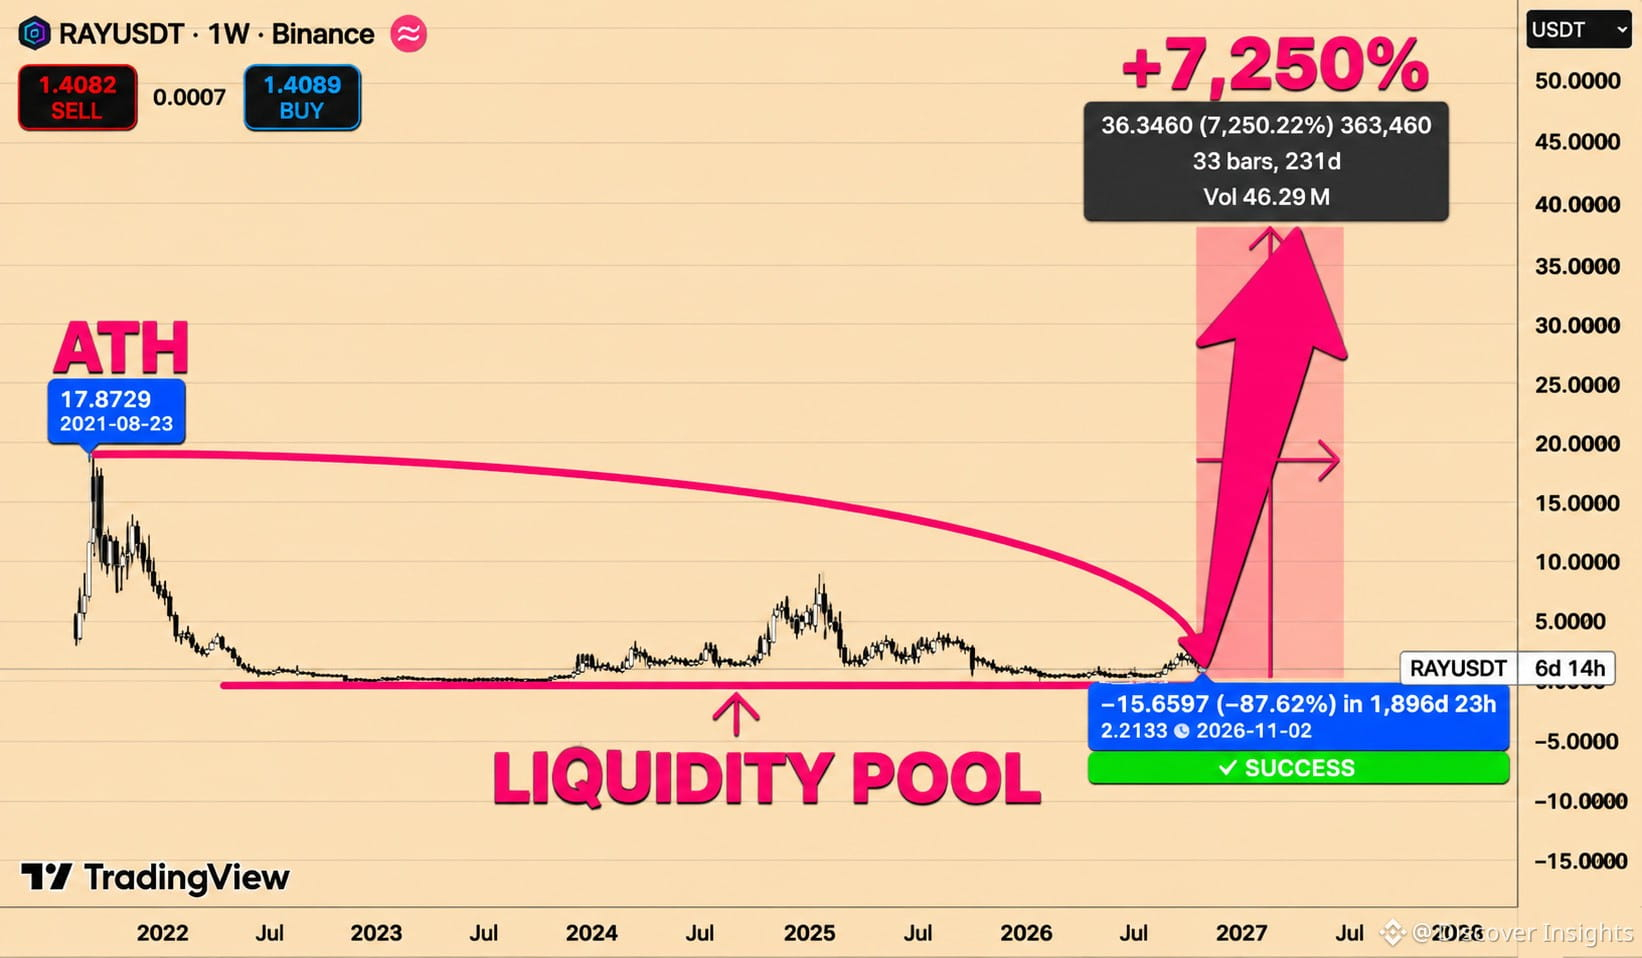
RAY is trading around $1.41, and its weekly chart is showing a potentially explosive long-term reversal setup.
Let's look at the bigger picture.
Back in 2021, Raydium reached an ATH of $17.87 before entering a prolonged bearish cycle.
Years of selling pressure followed, with price gradually returning toward its historical lows.
But here's what caught my attention.
RAY is now trading near a major historical liquidity zone — an area that could potentially become the foundation for another accumulation phase.
And the long-term projection is remarkable.
My bullish roadmap:
🎯 $2.50 — First resistance to reclaim
🎯 $5.00 — Important recovery checkpoint
🎯 $8–10 — Major resistance zone
🎯 $17.87 — Previous ATH
🎯 $20.00 — Potential breakout continuation
🎯 $35–38 — Extreme bull scenario
The chart also highlights a potential 7,250% expansion from its marked historical reference point.
That's an extremely aggressive projection, not a guaranteed outcome.
But before getting excited, buyers need to prove themselves.
First, I want to see RAY reclaim $2.50 and establish higher lows on the weekly timeframe.
A confirmed breakout above $5 with expanding volume would significantly strengthen the bullish case.
Without those confirmations, further downside remains possible.
Remember, a prolonged consolidation doesn't automatically mean accumulation, and historical support can fail.
Still, after years of correction, this is a chart worth keeping on the radar.
Could RAY be preparing for its next major expansion? 👀
#AnthropicIPOTestsInvestorAppetiteForAI
$RAY
RAY is trading around $1.41, and its weekly chart is showing a potentially explosive long-term reversal setup.
Let's look at the bigger picture.
Back in 2021, Raydium reached an ATH of $17.87 before entering a prolonged bearish cycle.
Years of selling pressure followed, with price gradually returning toward its historical lows.
But here's what caught my attention.
RAY is now trading near a major historical liquidity zone — an area that could potentially become the foundation for another accumulation phase.
And the long-term projection is remarkable.
My bullish roadmap:
🎯 $2.50 — First resistance to reclaim
🎯 $5.00 — Important recovery checkpoint
🎯 $8–10 — Major resistance zone
🎯 $17.87 — Previous ATH
🎯 $20.00 — Potential breakout continuation
🎯 $35–38 — Extreme bull scenario
The chart also highlights a potential 7,250% expansion from its marked historical reference point.
That's an extremely aggressive projection, not a guaranteed outcome.
But before getting excited, buyers need to prove themselves.
First, I want to see RAY reclaim $2.50 and establish higher lows on the weekly timeframe.
A confirmed breakout above $5 with expanding volume would significantly strengthen the bullish case.
Without those confirmations, further downside remains possible.
Remember, a prolonged consolidation doesn't automatically mean accumulation, and historical support can fail.
Still, after years of correction, this is a chart worth keeping on the radar.
Could RAY be preparing for its next major expansion? 👀
#AnthropicIPOTestsInvestorAppetiteForAI
$RAY