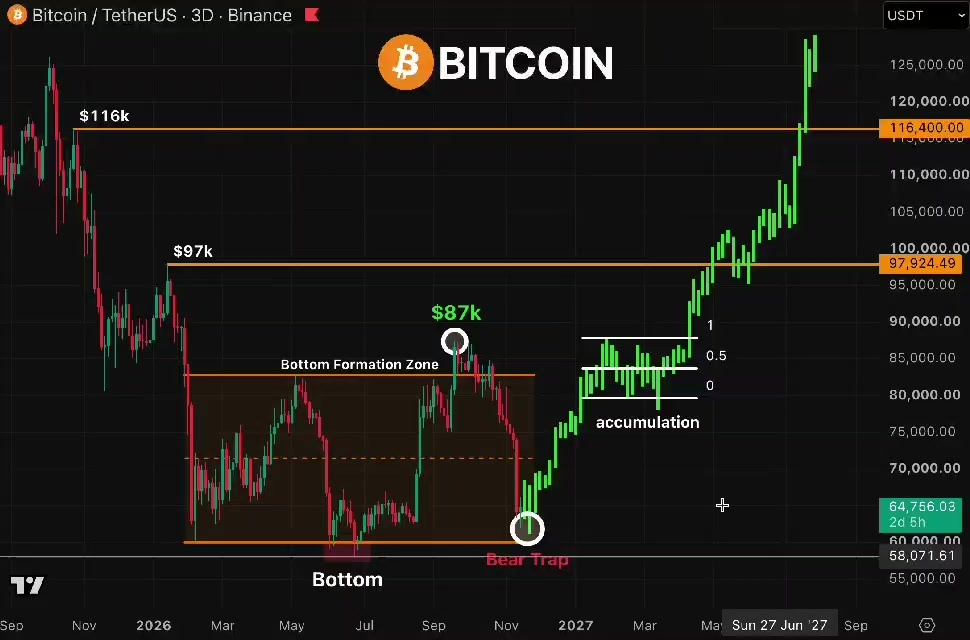

$BTC — Bitcoin could rally nearly 28% from here and still be trading inside a damaged market structure. That's the detail I want traders to understand before looking at the $98,000 and $116,400 projections in my two 3-day charts. BTC is trading around $64,100. Even a recovery toward $82,000 would represent approximately 28% upside from this price. That sounds impressive. But on my chart, $82,000 is also where an important resistance region begins. The previous swing high near $87,000 sits inside that broader supply area, which extends into the low $90,000s. So a powerful rally alone wouldn't necessarily mean Bitcoin has established a new bullish trend. Price could recover significantly and still face rejection beneath its previous major high. This distinction is important for my investment strategy. On November 15, BTC tested approximately $62,000 and recovered to close near $65,350. That reaction occurred around the lower support region highlighted in both videos. I consider this an interesting development, especially after such aggressive selling. But the latest price action hasn't confirmed a lasting reversal. For now, I'm studying how Bitcoin behaves between approximately $63,600 and $70,300. A sustained recovery above the upper part of this range, followed by stronger 3-day market structure, would improve my confidence considerably. Only then would I begin giving more weight to the next major challenge: recovering the resistance region around $82,000–$87,000. My two larger projections represent different stages of a potential recovery. The first objective is $97,924.49, where I expect another important market decision. The second is $116,400. I would only treat that higher objective as a serious continuation scenario if Bitcoin successfully absorbs the resistance around the first target. The projected green candles extending into 2027 illustrate my bullish scenario. They are not completed price action or evidence that the recovery is guaranteed. Risk Management The recent low near $62,000 is my first warning level. If BTC loses that area again, I would reassess whether buyers are genuinely establishing support. My broader structural invalidation remains around $58,000 on the 3-day chart. Sustained trading below that region would invalidate the recovery scenario presented in these videos. I wouldn't increase exposure simply because the distant targets offer attractive potential returns. Any new entry requires its own protective stop, suitable position size and a risk-to-reward calculation based on the actual execution price. I'm heavily bullish on Bitcoin's longer-term recovery potential. But there's a major difference between expecting a substantial recovery and assuming every rally confirms a new bull market. For this analysis, even a 28% advance could be only the beginning of the structural repair Bitcoin needs.