


As of mid-November 2026, BNB is undergoing a notable market correction, trading near $590.90.
After reaching a local peak of $758.69 in October, the asset lost nearly 19% of its value in a month and approached a critical support zone. Despite short-term selling pressure, the fundamentals of the BNB Chain ecosystem keep the token among the world's four largest cryptocurrencies by market capitalization (over $77.5 billion).
Technical analysis of the BNB/USD chart (daily timeframe) The daily chart (1D) shows a clear trend shift from a local rally to a prolonged decline and an attempt to stabilize. Overall movement and trend. In the second half of October, $BNB made a powerful upward move from around $610 to a peak of $758.69. However, buyers failed to hold above $750, after which a series of red candles formed, with lower highs and lower lows. Moving average (MA). The orange moving average initially acted as dynamic support during the rise, but after the price broke below it in late October, it turned into strong resistance. The price is now significantly below this line, confirming that bearish sentiment is dominant in the medium term. Key support zone ($569–$580).
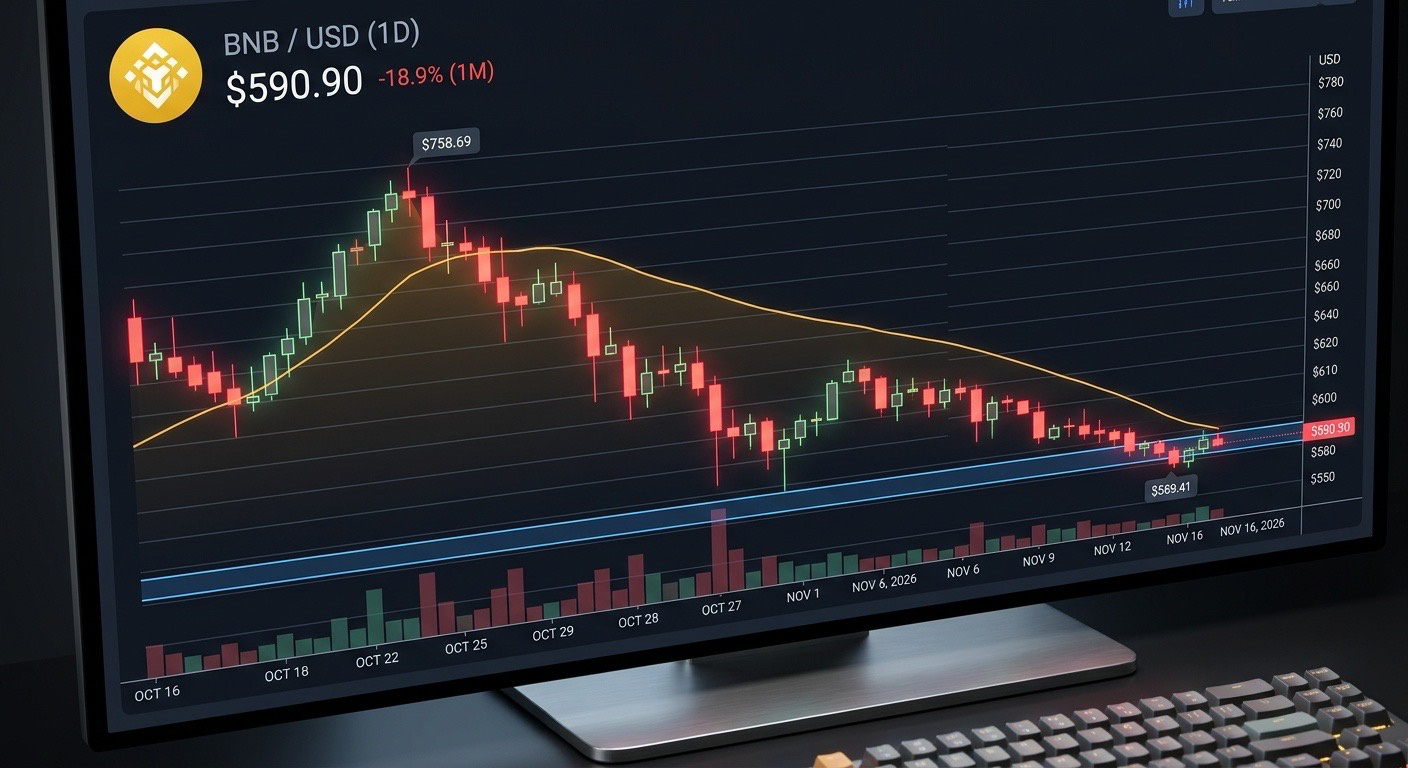 The blue horizontal band at the bottom of the chart marks a critical demand zone. A recent dip to a low of $569.41 was quickly bought up, producing a rebound to the current price of $590.90. This indicates that large players are actively defending the $570–$580 level. Trading volume. The histogram at the bottom shows that the largest volume spikes occurred during the late-October decline and when the local bottom was tested. The past few days have seen moderate volume, which is typical of a consolidation phase before the next move.
