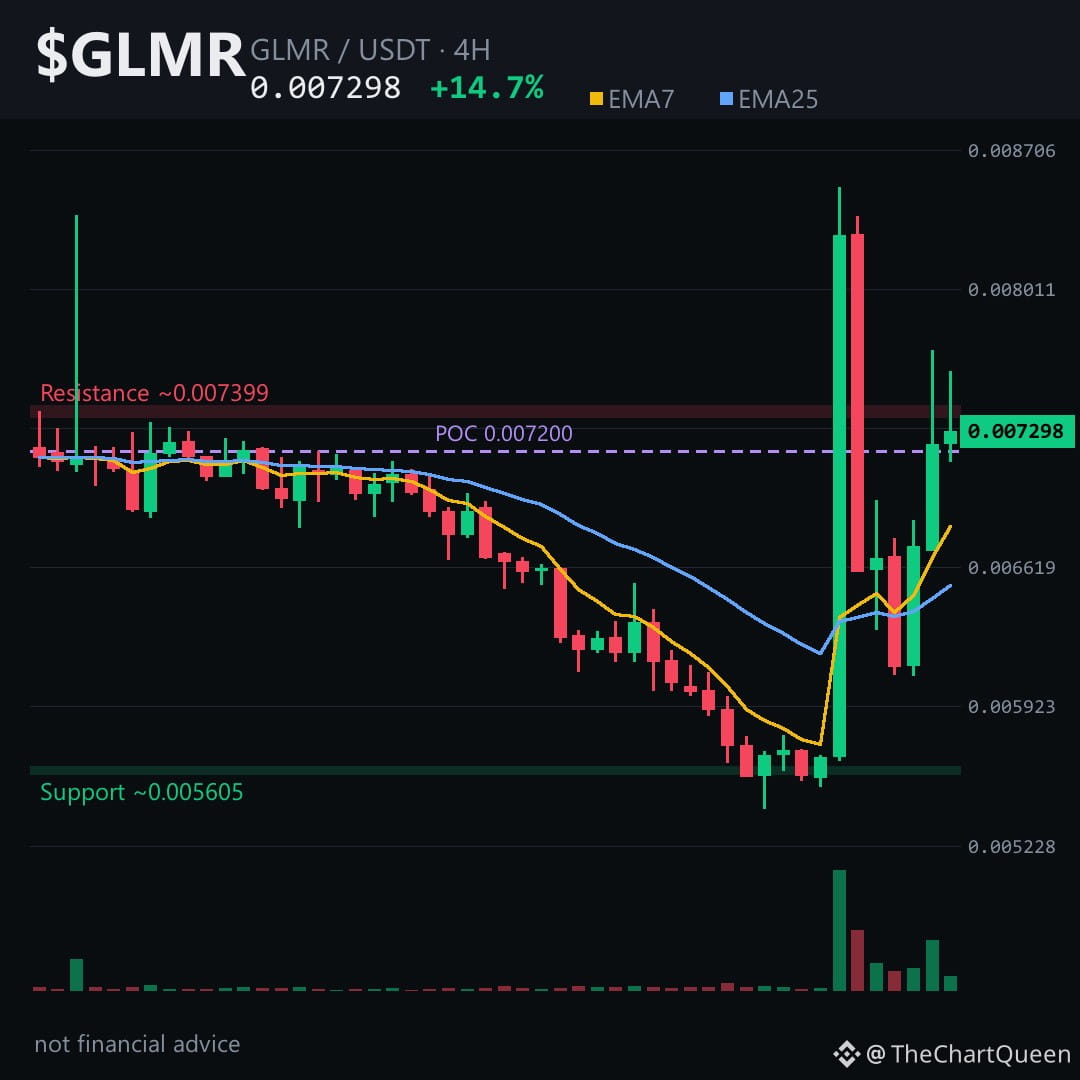
Why did $GLMR just spike 45% in a single 4-hour candle — and then hand back nearly half of it?
That explosive green candle pushed price straight into the volume profile's point of control around 0.0072, got rejected, fell 20%, and has been rebuilding since.
The 4-hour picture is quietly bullish: shorter-term MAs stacked above longer ones, RSI neutral, higher lows for 12 hours. A staircase pattern — often keeps grinding up once the spike digests.
The level that matters most is 0.0069. That's the 4-hour invalidation zone — lose that on a close, and the bullish read falls apart. If it holds, path of least resistance points toward 0.0079, matching the highs from that wild candle.
Tap $GLMR to pull up the chart and see the structure yourself.
My read: 4-hour trend is constructive, but the daily is still bearish, so any upside is a bounce within a larger downtrend until proven otherwise.
I'll be watching how $GLMR behaves around 0.0069 in the next few sessions — follow along for that update.
What's the one level on your chart that makes or breaks this setup for you? 👇
⚠️ Not financial advice. DYOR.
#GLMR #Moonbeam #Crypto #BinanceSquare
That explosive green candle pushed price straight into the volume profile's point of control around 0.0072, got rejected, fell 20%, and has been rebuilding since.
The 4-hour picture is quietly bullish: shorter-term MAs stacked above longer ones, RSI neutral, higher lows for 12 hours. A staircase pattern — often keeps grinding up once the spike digests.
The level that matters most is 0.0069. That's the 4-hour invalidation zone — lose that on a close, and the bullish read falls apart. If it holds, path of least resistance points toward 0.0079, matching the highs from that wild candle.
Tap $GLMR to pull up the chart and see the structure yourself.
My read: 4-hour trend is constructive, but the daily is still bearish, so any upside is a bounce within a larger downtrend until proven otherwise.
I'll be watching how $GLMR behaves around 0.0069 in the next few sessions — follow along for that update.
What's the one level on your chart that makes or breaks this setup for you? 👇
⚠️ Not financial advice. DYOR.
#GLMR #Moonbeam #Crypto #BinanceSquare