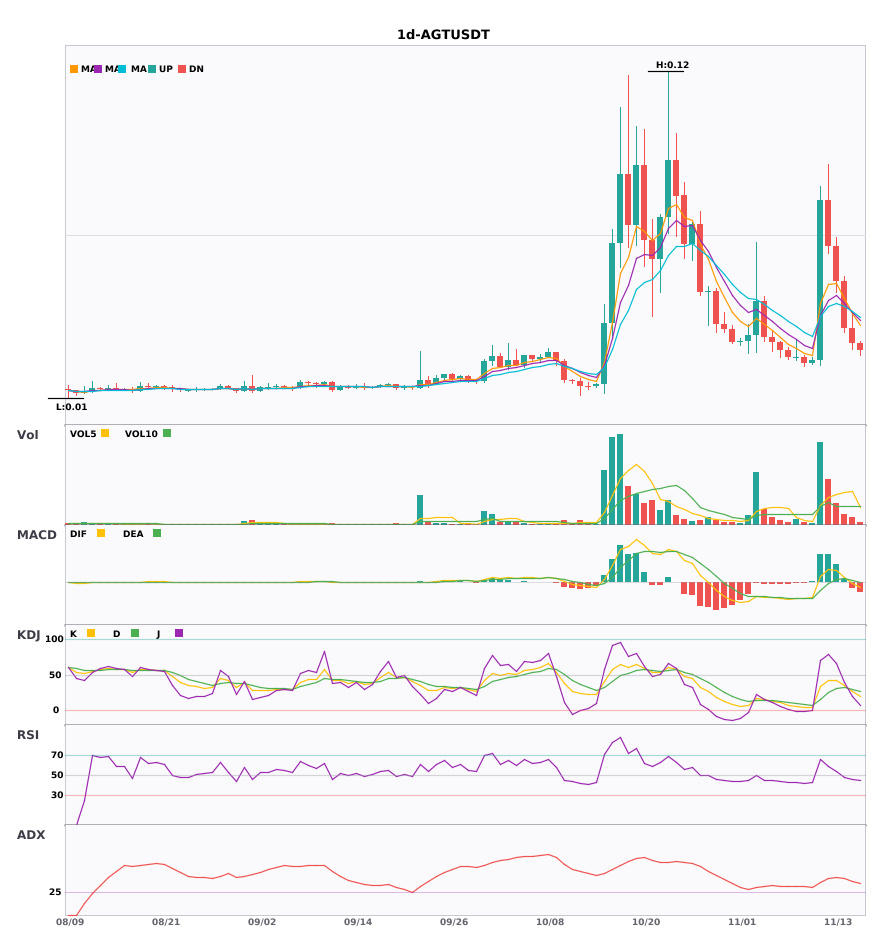
$AGT Daily chart is weakening with a bearish bias; considerable short-term pressure ahead 🔥
════════════════════
🟢 $AGT Daily-chart bearish signals
⚠️ Technicals: ADX at 37 indicates a clear trend. The MACD bearish crossover is followed by expanding green bars, and the moving averages are bearishly aligned. KDJ's K line has crossed below D and is not yet in oversold territory. Volume has contracted to 0.6x—bearish.
════════════════════
🔔 Follow us for firsthand market updates 🔔
#技术分析 #AGT
📌 When trading, pay attention to whether the candlestick pattern confirms the signal.
════════════════════
🟢 $AGT Daily-chart bearish signals
⚠️ Technicals: ADX at 37 indicates a clear trend. The MACD bearish crossover is followed by expanding green bars, and the moving averages are bearishly aligned. KDJ's K line has crossed below D and is not yet in oversold territory. Volume has contracted to 0.6x—bearish.
════════════════════
🔔 Follow us for firsthand market updates 🔔
#技术分析 #AGT
📌 When trading, pay attention to whether the candlestick pattern confirms the signal.