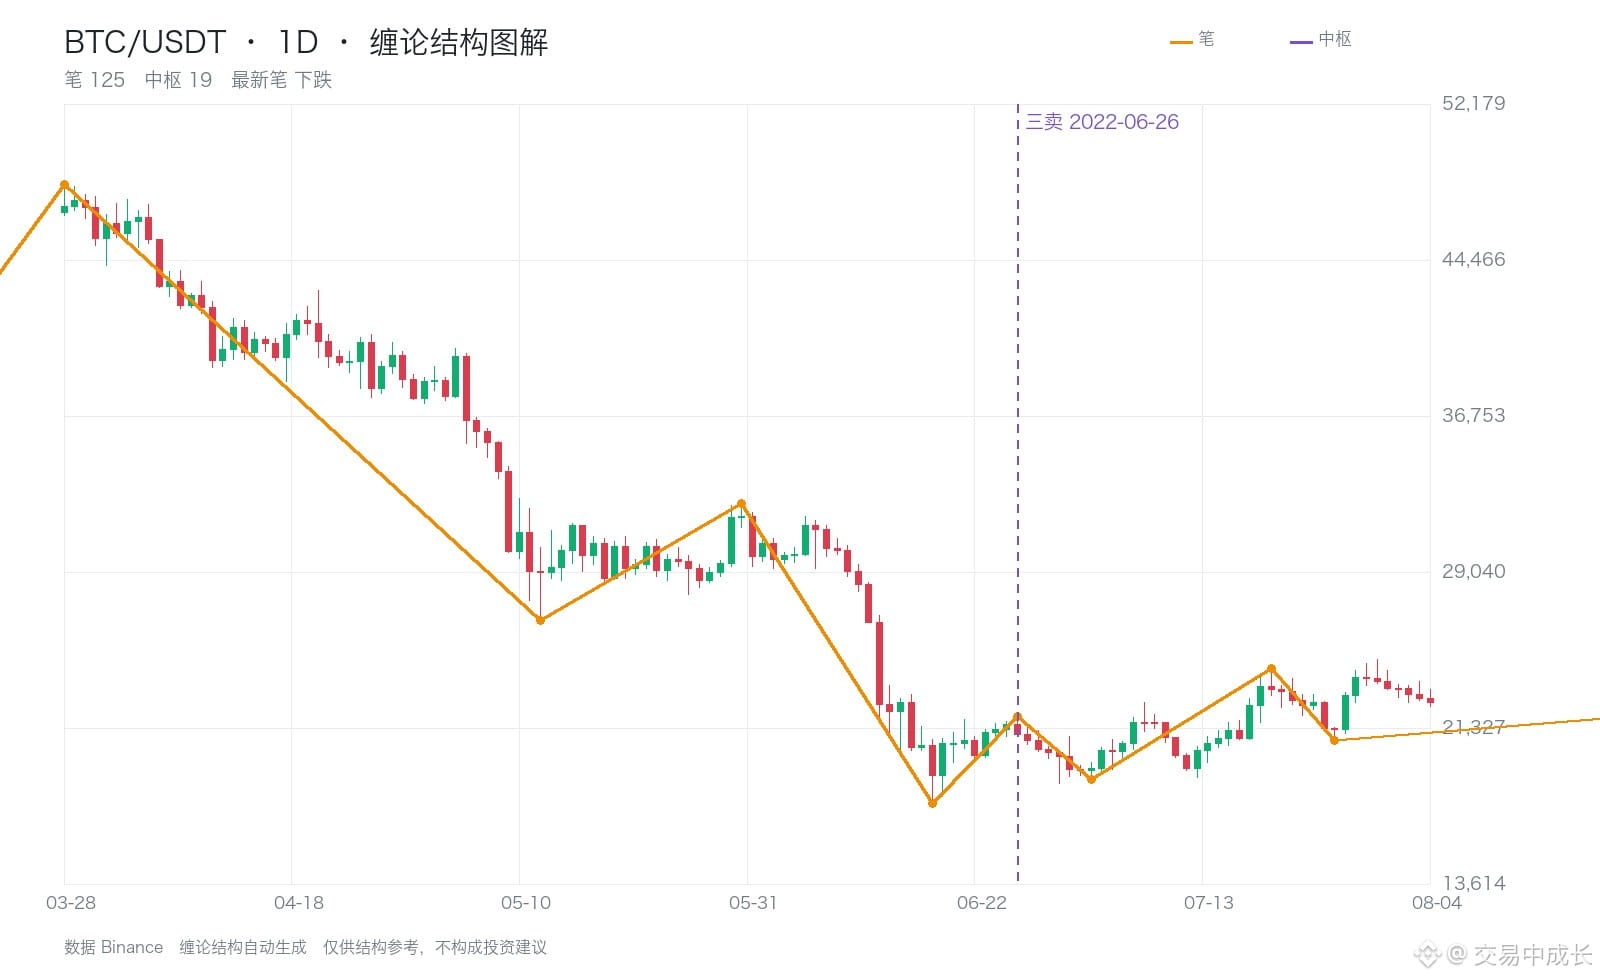
Let's review a historical example: On June 26, 2022, BTC showed a third sell signal on the 1D timeframe.
At the time, the central zone was 40,889–45,848, and the signal price of 21,888 was below the lower boundary of the zone at 40,889.
After the signal appeared, the price fell as low as 18,563 within 20 candlesticks, a 15.2% drop from the signal price (closing at 21,184).
That's the value of a third sell: the zone determines the position, the stop-loss goes where the structure is invalidated, and losses stay small while gains can be large.
History doesn't repeat itself exactly, but structures recur. You need to see the same pattern many times before you dare to act on a genuine signal.
$BTC $ETH #缠论 #BTC失守65000 #WhaleUnrealizedLoss
At the time, the central zone was 40,889–45,848, and the signal price of 21,888 was below the lower boundary of the zone at 40,889.
After the signal appeared, the price fell as low as 18,563 within 20 candlesticks, a 15.2% drop from the signal price (closing at 21,184).
That's the value of a third sell: the zone determines the position, the stop-loss goes where the structure is invalidated, and losses stay small while gains can be large.
History doesn't repeat itself exactly, but structures recur. You need to see the same pattern many times before you dare to act on a genuine signal.
$BTC $ETH #缠论 #BTC失守65000 #WhaleUnrealizedLoss