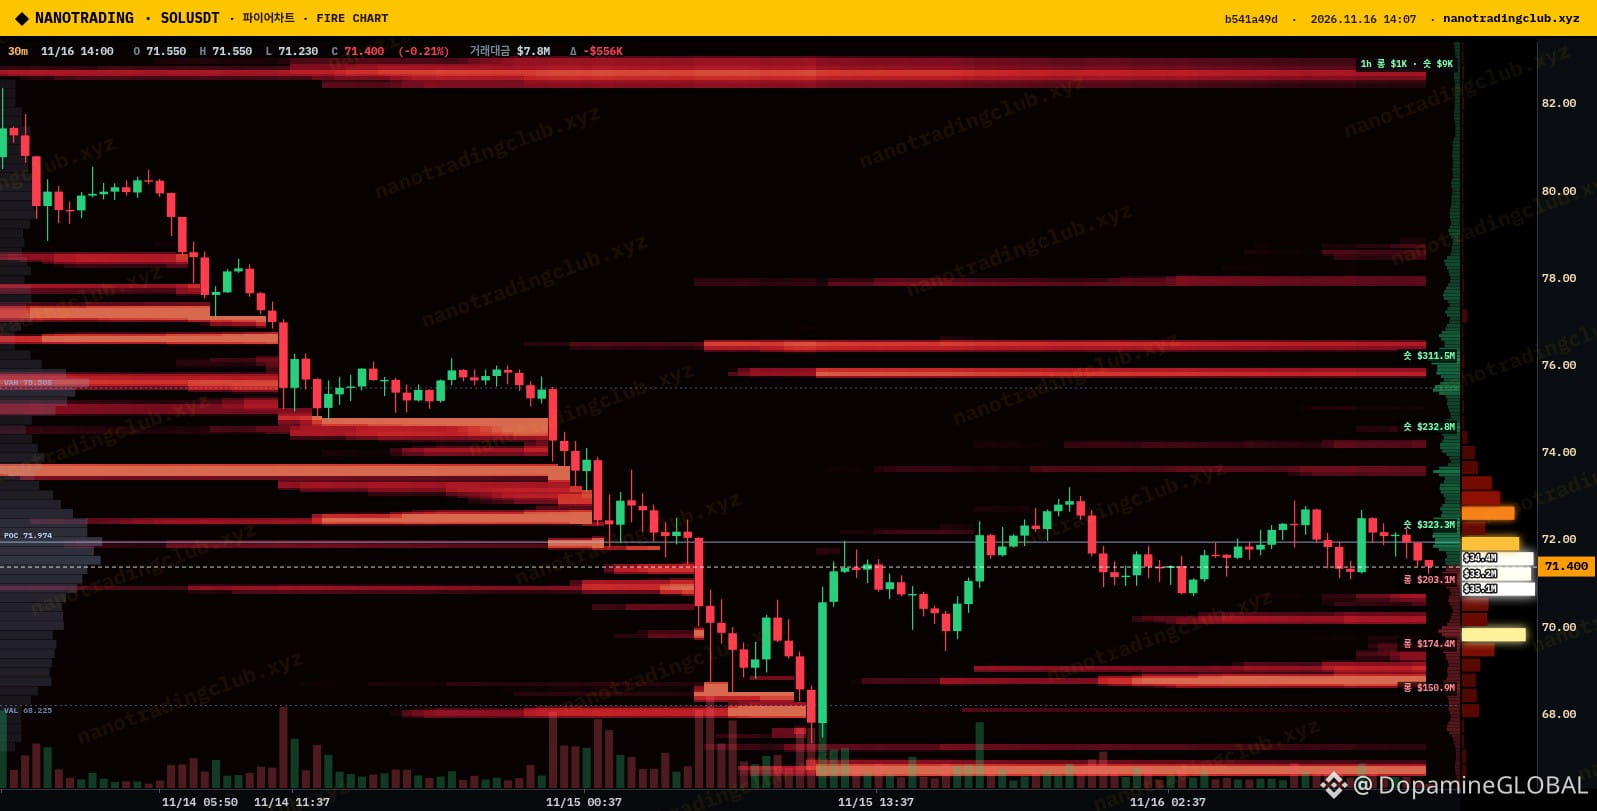
$SOL is sitting at 71.4 and the 30m liquidation heatmap on NanoTrading looks like a coiled spring to me. Right above price there's a short cluster marked around 72.2 (~$323M), then more stacked near 74.3 and 76. Right below, the long side is heavier: ~$263M near 71.2 and the big one, ~$574M, around 70.2.
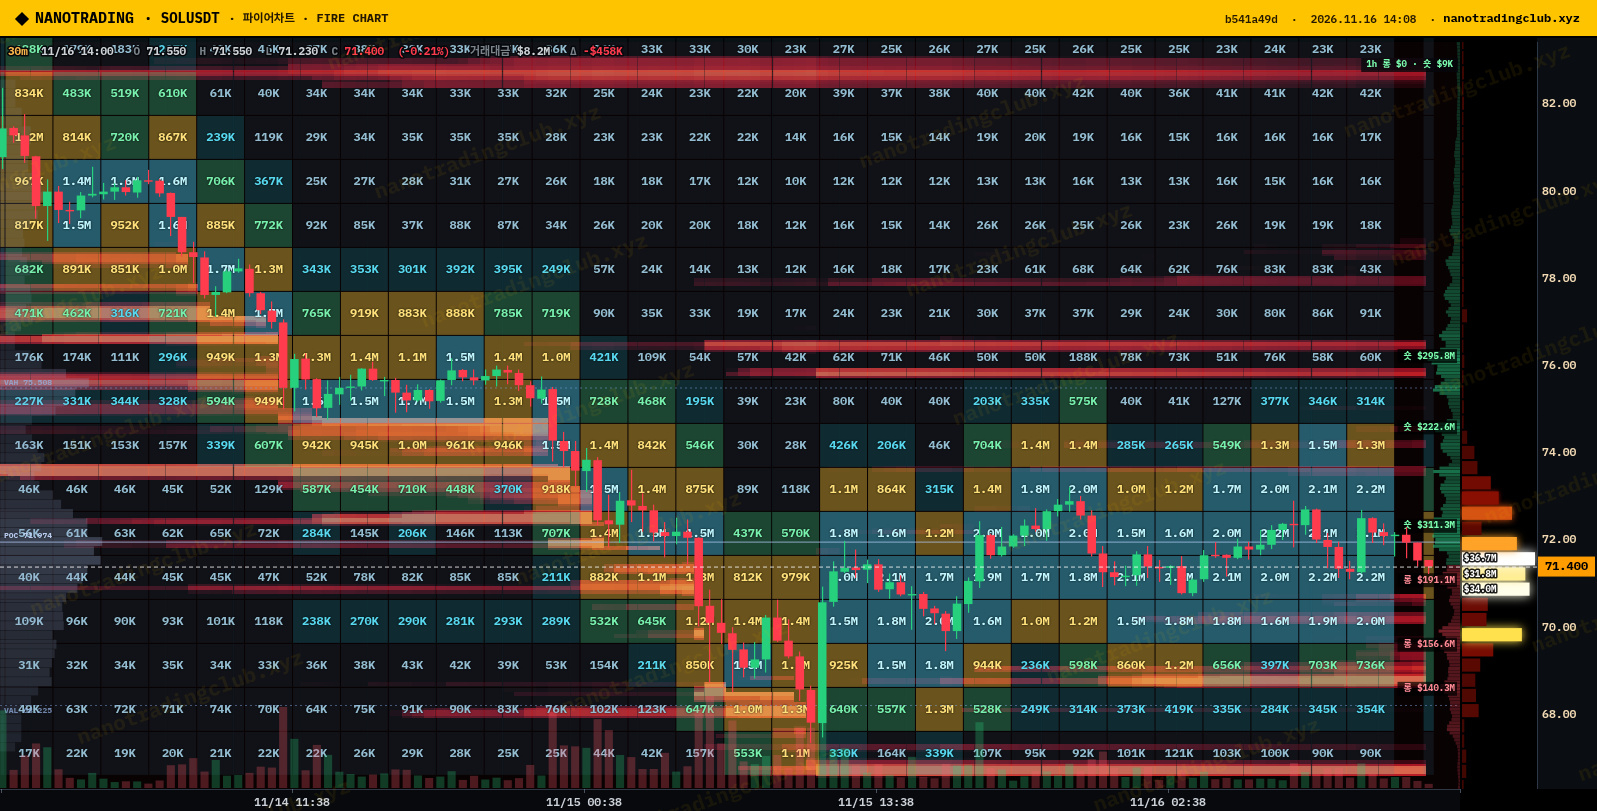
The integrated orderbook view tells the same story. The fattest cells sit in the 70-72 rows, so this tight 70-72 box is where the real liquidity lives. Whichever side of it breaks first probably gets dragged to the next band fast.
Binance futures data has me leaning cautious on longs. SOLUSDT funding is negative (-0.0125%), OI slipped from about 9.19M to 8.93M SOL over the last ~23h, but the account long/short ratio is still 3.59 and top traders are ~1.93 long. That many longs with a $574M pocket under 70.2 looks like an easy target to me. I'd want a clean 30m close above 72.2 before trusting upside; lose 70 and I expect a quick sweep toward 69-68.
Charts (Fire liquidation heatmap + integrated orderbook, 30m): NanoTrading (nanotradingclub.xyz). Data: Binance futures.
Which side of 70-72 do you think gets hunted first? 🤔
NFA, just my read.
#SOL #Solana #NanoTrading #CryptoMarket
The integrated orderbook view tells the same story. The fattest cells sit in the 70-72 rows, so this tight 70-72 box is where the real liquidity lives. Whichever side of it breaks first probably gets dragged to the next band fast.
Binance futures data has me leaning cautious on longs. SOLUSDT funding is negative (-0.0125%), OI slipped from about 9.19M to 8.93M SOL over the last ~23h, but the account long/short ratio is still 3.59 and top traders are ~1.93 long. That many longs with a $574M pocket under 70.2 looks like an easy target to me. I'd want a clean 30m close above 72.2 before trusting upside; lose 70 and I expect a quick sweep toward 69-68.
Charts (Fire liquidation heatmap + integrated orderbook, 30m): NanoTrading (nanotradingclub.xyz). Data: Binance futures.
Which side of 70-72 do you think gets hunted first? 🤔
NFA, just my read.
#SOL #Solana #NanoTrading #CryptoMarket