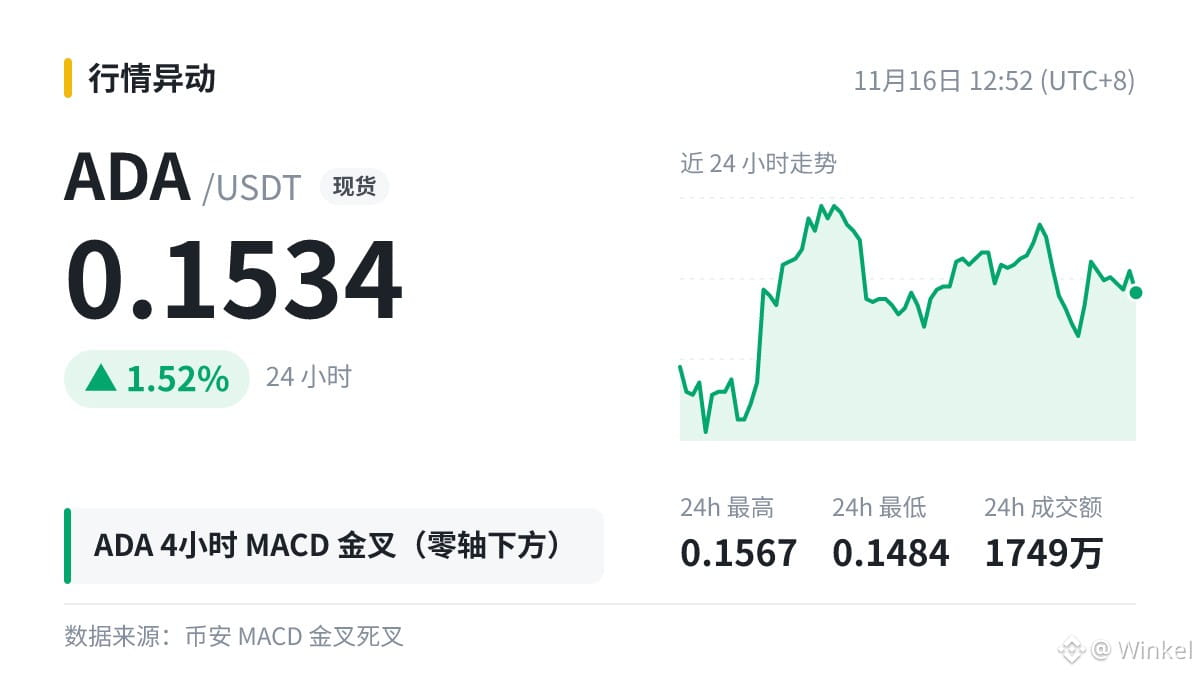
$ADA 4The hourly chart has just formed a MACD golden cross (below the zero line). Before the crossover, the bearish momentum histogram persisted for 14 four-hour candlesticks.
It’s easy to misread the signal if you focus only on the crossover, so I’ll check three things in order:
① Does the histogram continue to grow after turning positive?
② Is volume picking up?
③ Can the price break above the previous high?
Four-hour signals move quickly, so it’s best to compare them with the daily trend. How do you interpret this data?
It’s easy to misread the signal if you focus only on the crossover, so I’ll check three things in order:
① Does the histogram continue to grow after turning positive?
② Is volume picking up?
③ Can the price break above the previous high?
Four-hour signals move quickly, so it’s best to compare them with the daily trend. How do you interpret this data?