【Strategy Breakdown: Why You Should Check the Higher Timeframe First】
For the same coin, the 1H chart is bullish, but the 30-minute chart has just turned bearish—which one do you trade?
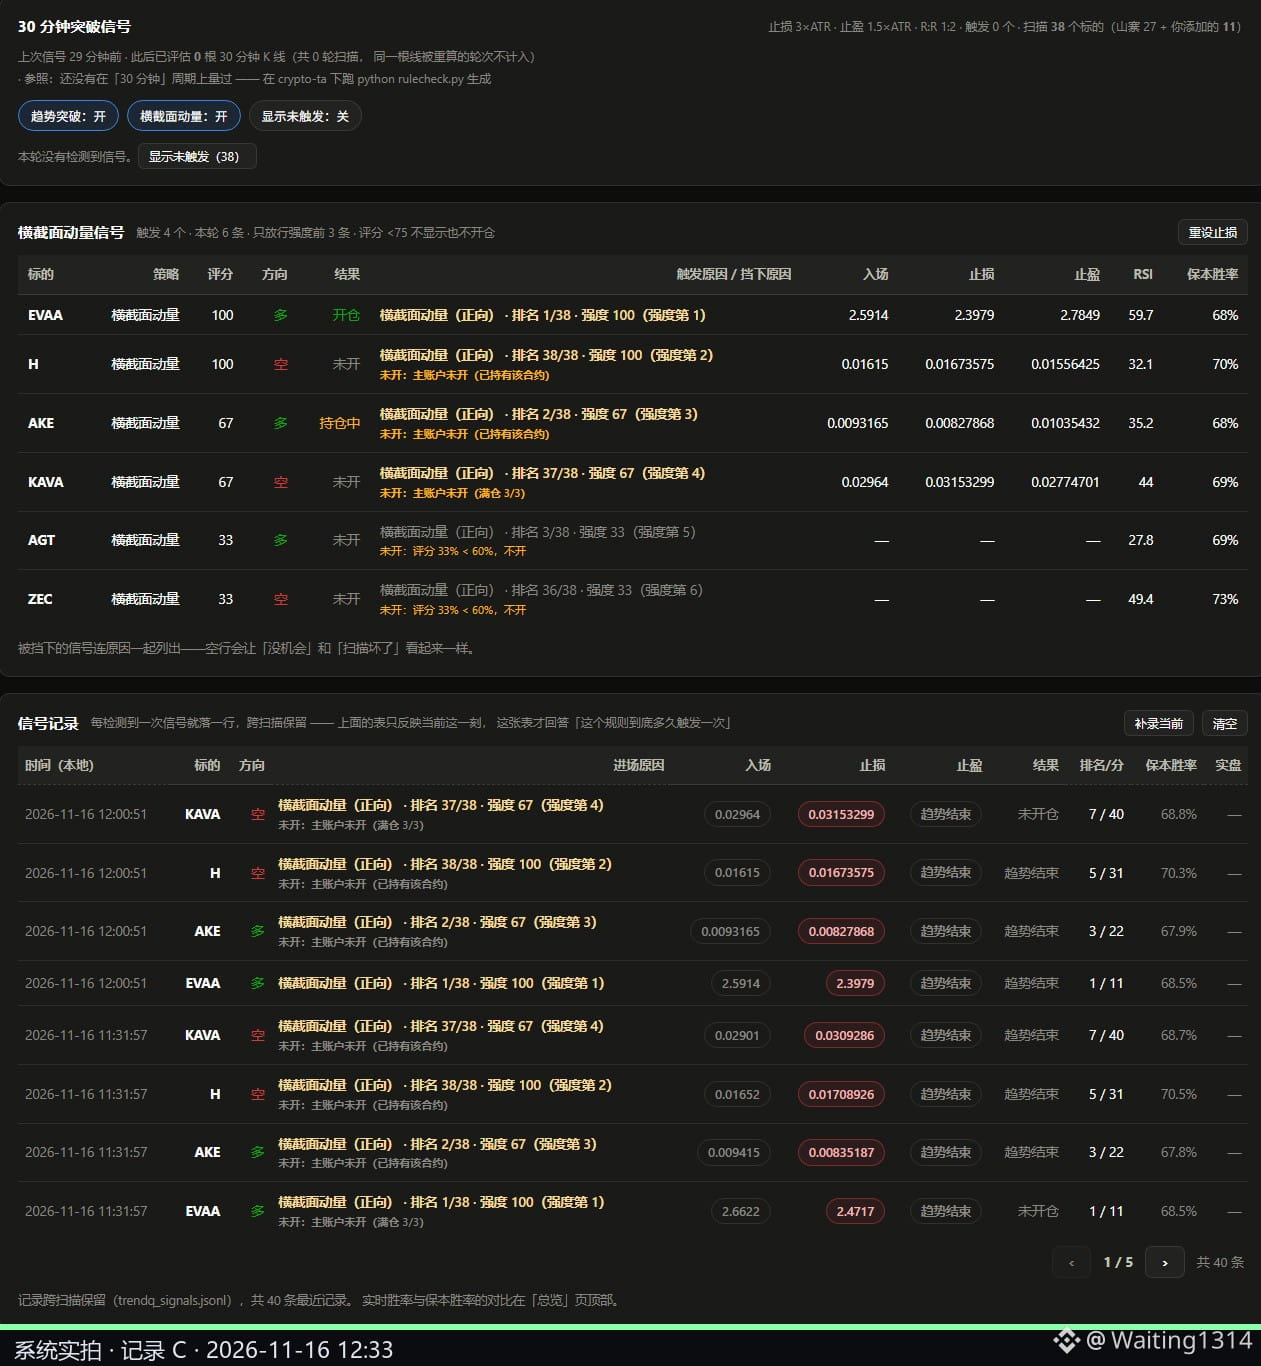
① The 1-hour chart only determines whether you’re allowed to go long or short;
② The 30-minute chart provides the specific entry point;
③ If there’s no entry point, wait—don’t jump in early.
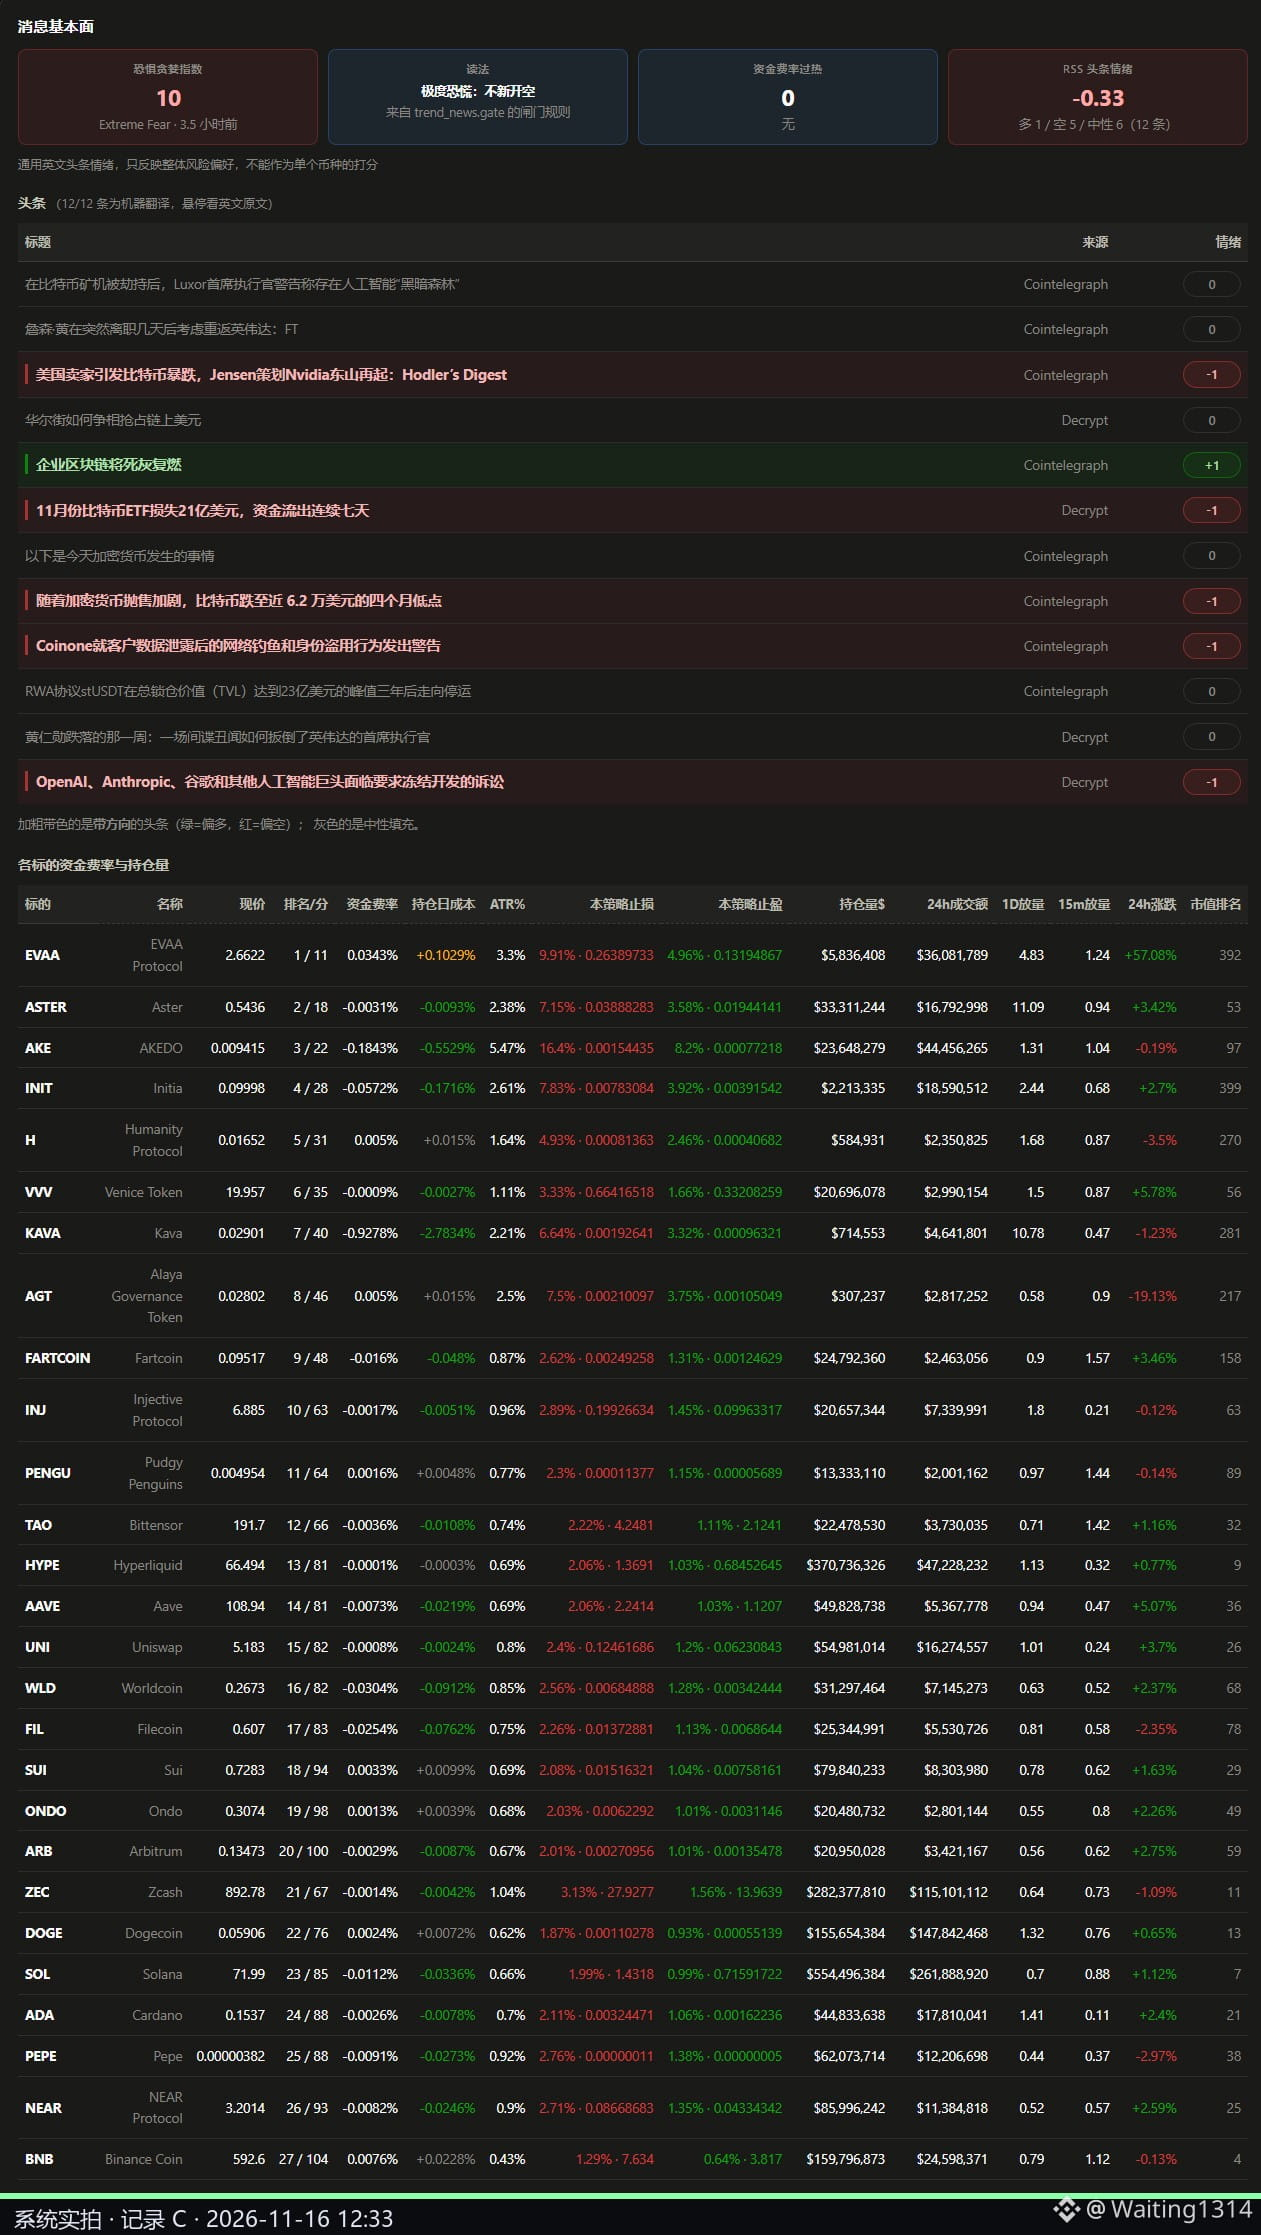
Position size isn’t based on gut feeling; it’s calculated using a stop-loss distance of 3×ATR.
Screenshots of the settings page—the rules aren’t hidden. Which step would you like me to break down? Let me know in the comments.
#量化策略 #趋势交易 #BTC #crypto
(Not investment advice. Contract trading carries a risk of liquidation.)
You’re welcome to join the group—we can go over the details there 👇
For the same coin, the 1H chart is bullish, but the 30-minute chart has just turned bearish—which one do you trade?
① The 1-hour chart only determines whether you’re allowed to go long or short;
② The 30-minute chart provides the specific entry point;
③ If there’s no entry point, wait—don’t jump in early.
Position size isn’t based on gut feeling; it’s calculated using a stop-loss distance of 3×ATR.
Screenshots of the settings page—the rules aren’t hidden. Which step would you like me to break down? Let me know in the comments.
#量化策略 #趋势交易 #BTC #crypto
(Not investment advice. Contract trading carries a risk of liquidation.)
You’re welcome to join the group—we can go over the details there 👇