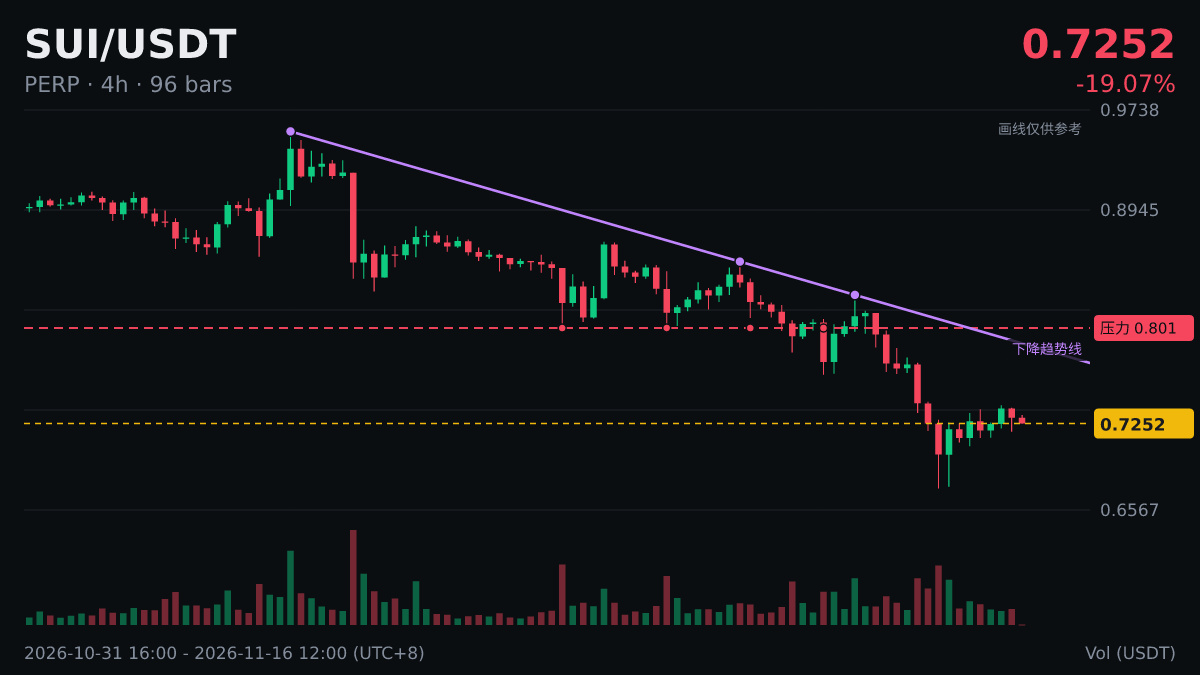
$SUI 4 hours MACD forms a golden cross below the zero line.
Let’s talk about what lies behind this number.
The MACD histogram is the difference between DIF and DEA; many domestic trading platforms also multiply it by 2. When the histogram turns from negative to positive, DIF has just crossed above DEA.
A death cross above the zero line is often seen as a slowdown in upward momentum, but it doesn’t necessarily mean the trend is over. A death cross below the zero line is often viewed as a continuation of weakness.
Indicators can be inaccurate, so risk management must not be neglected: deciding in advance what to do if you’re wrong is more important than getting the prediction right.
#SUI
Let’s talk about what lies behind this number.
The MACD histogram is the difference between DIF and DEA; many domestic trading platforms also multiply it by 2. When the histogram turns from negative to positive, DIF has just crossed above DEA.
A death cross above the zero line is often seen as a slowdown in upward momentum, but it doesn’t necessarily mean the trend is over. A death cross below the zero line is often viewed as a continuation of weakness.
Indicators can be inaccurate, so risk management must not be neglected: deciding in advance what to do if you’re wrong is more important than getting the prediction right.
#SUI