
🚨THIS IS NOT NORMAL
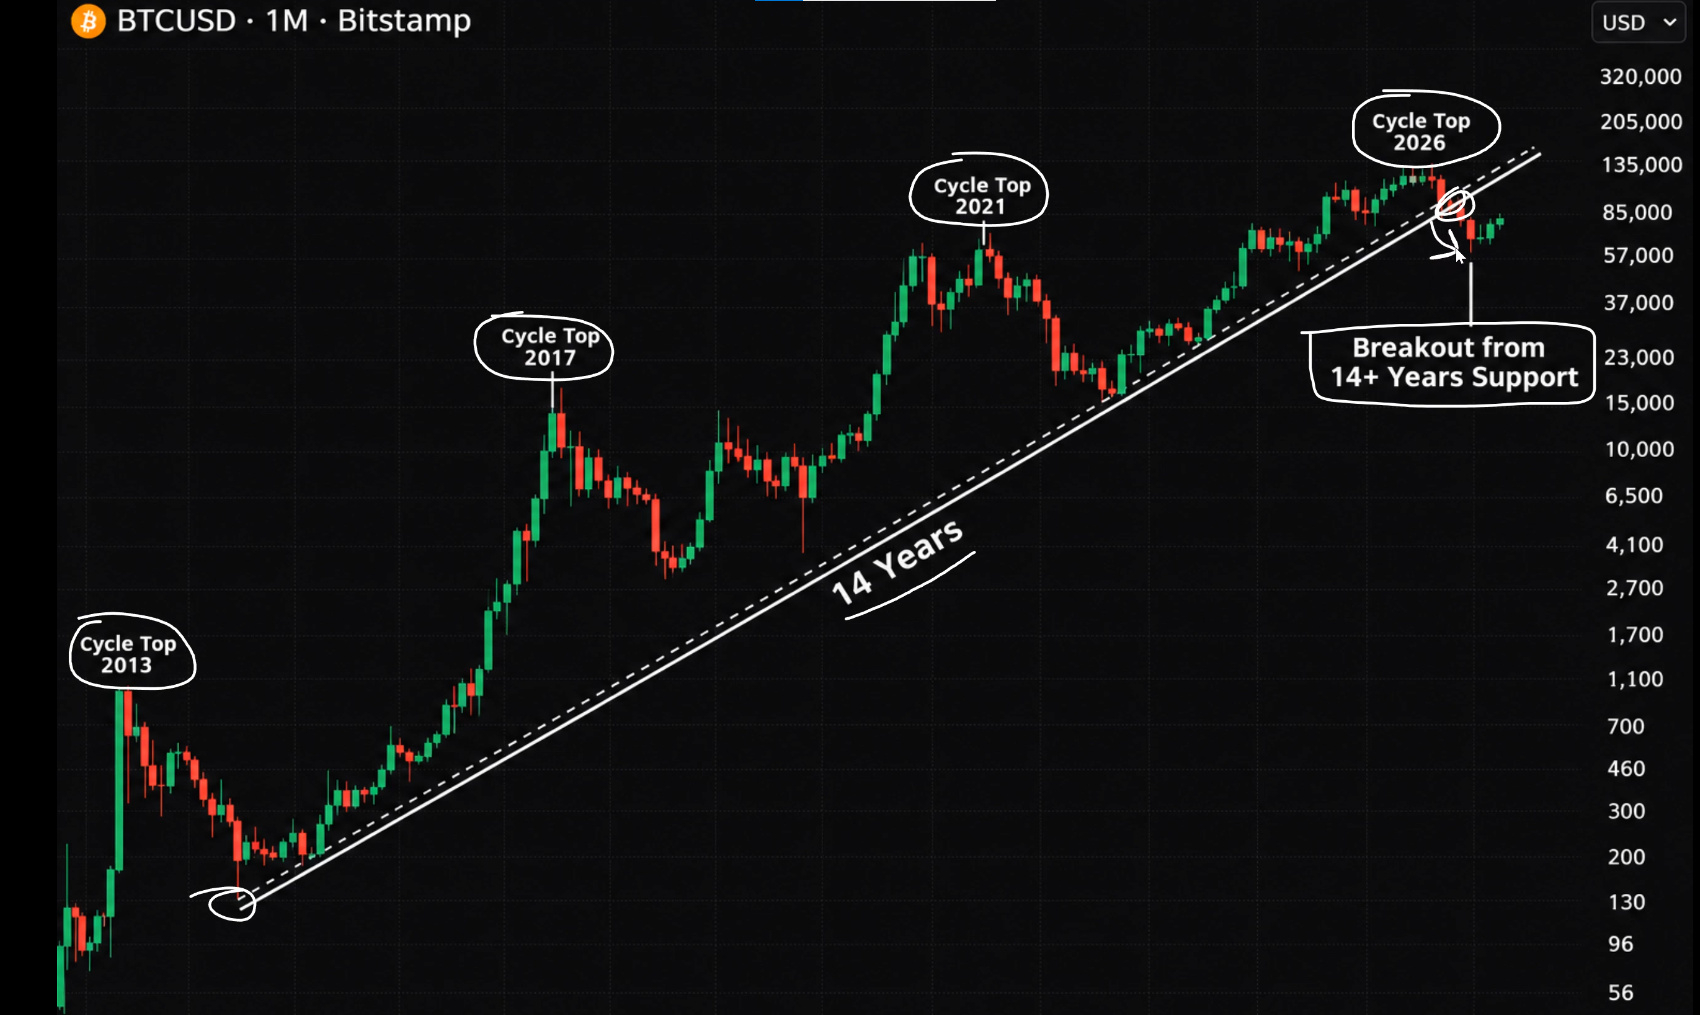
Bitcoin has finally broken its 14-year trendline.
And almost NO ONE understands how serious this is.
Look at the historical pattern:
• 2013 → Cycle top.
• 2017 → Cycle top.
• 2021 → Cycle top.
• 2026 → Another major crash.
For over a decade, this rising trendline has shaped Bitcoin’s long-term bullish structure.
Now, for the first time, $BTC is trading BELOW it.
But here’s what everyone is MISSING:
→ Bitcoin has lost $70K.
→ The 200-week moving average near $68K has been broken.
→ $62K is the next key level.
→ Below that, $58K comes back into play.
This isn’t just another routine correction.
If Bitcoin can’t reclaim the broken support, we could be witnessing a MAJOR SHIFT in the entire market cycle.
One thing matters now: THE MONTH-END CLOSE.
A recovery could turn this into a MASSIVE BEAR TRAP.
But a confirmed monthly breakdown would be a serious warning.
Same Bitcoin. Different market structure.
SAVE THIS CHART MAP.
Bitcoin has finally broken its 14-year trendline.
And almost NO ONE understands how serious this is.
Look at the historical pattern:
• 2013 → Cycle top.
• 2017 → Cycle top.
• 2021 → Cycle top.
• 2026 → Another major crash.
For over a decade, this rising trendline has shaped Bitcoin’s long-term bullish structure.
Now, for the first time, $BTC is trading BELOW it.
But here’s what everyone is MISSING:
→ Bitcoin has lost $70K.
→ The 200-week moving average near $68K has been broken.
→ $62K is the next key level.
→ Below that, $58K comes back into play.
This isn’t just another routine correction.
If Bitcoin can’t reclaim the broken support, we could be witnessing a MAJOR SHIFT in the entire market cycle.
One thing matters now: THE MONTH-END CLOSE.
A recovery could turn this into a MASSIVE BEAR TRAP.
But a confirmed monthly breakdown would be a serious warning.
Same Bitcoin. Different market structure.
SAVE THIS CHART MAP.