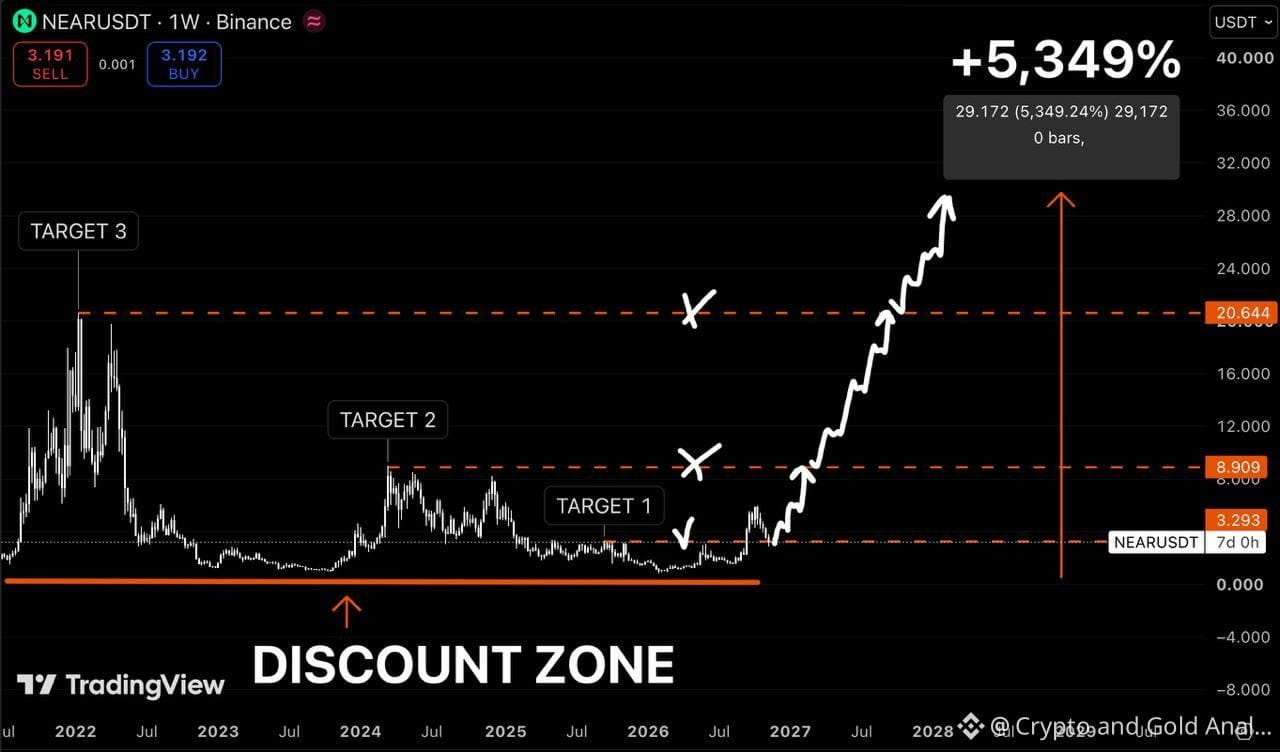
$NEAR is trading around $3.19.
And this weekly chart is showing a potentially massive long-term breakout setup.
Back in 2022, $NEAR reached above $20 before experiencing a brutal correction.
In 2024, another major rally pushed price toward $9.
Now, after years of corrections and consolidation, $NEAR is trading near an important historical support region.
But here's what caught my attention.
Price has returned to a long-term discount zone, while previous cycle highs provide clear upside targets.
The chart projects a potential 5,349% expansion from its marked historical base.
Here's my roadmap:
$3.293 — Target 1.
$5 — First major recovery checkpoint.
$8.909 — Target 2.
$12–15 — Bullish continuation.
$20.644 — Target 3.
$30–33 — Extreme bull scenario.
But first, buyers need to reclaim $3.293 and establish higher lows on the weekly timeframe.
A sustained breakout above $8.909 with strong volume would significantly strengthen the bullish case.
Until then, another correction remains possible.
The 5,349% projection is extremely speculative, not a guaranteed outcome.
Still, if this historical discount zone holds and buyers regain control, $Near could be approaching an important turning point.
The next major cycle could be very interesting.
#CryptoSelloffTriggersMultipleWhaleLiquidations #HuangReportedlyConsidersReturnToNvidia #About64000BitcoinMiningMachinesReportedlyHijacked #USSpotXRPETFsSeeLargestWeeklyOutflowIn8Months
And this weekly chart is showing a potentially massive long-term breakout setup.
Back in 2022, $NEAR reached above $20 before experiencing a brutal correction.
In 2024, another major rally pushed price toward $9.
Now, after years of corrections and consolidation, $NEAR is trading near an important historical support region.
But here's what caught my attention.
Price has returned to a long-term discount zone, while previous cycle highs provide clear upside targets.
The chart projects a potential 5,349% expansion from its marked historical base.
Here's my roadmap:
$3.293 — Target 1.
$5 — First major recovery checkpoint.
$8.909 — Target 2.
$12–15 — Bullish continuation.
$20.644 — Target 3.
$30–33 — Extreme bull scenario.
But first, buyers need to reclaim $3.293 and establish higher lows on the weekly timeframe.
A sustained breakout above $8.909 with strong volume would significantly strengthen the bullish case.
Until then, another correction remains possible.
The 5,349% projection is extremely speculative, not a guaranteed outcome.
Still, if this historical discount zone holds and buyers regain control, $Near could be approaching an important turning point.
The next major cycle could be very interesting.
#CryptoSelloffTriggersMultipleWhaleLiquidations #HuangReportedlyConsidersReturnToNvidia #About64000BitcoinMiningMachinesReportedlyHijacked #USSpotXRPETFsSeeLargestWeeklyOutflowIn8Months