#GOLD is teaching us a lesson
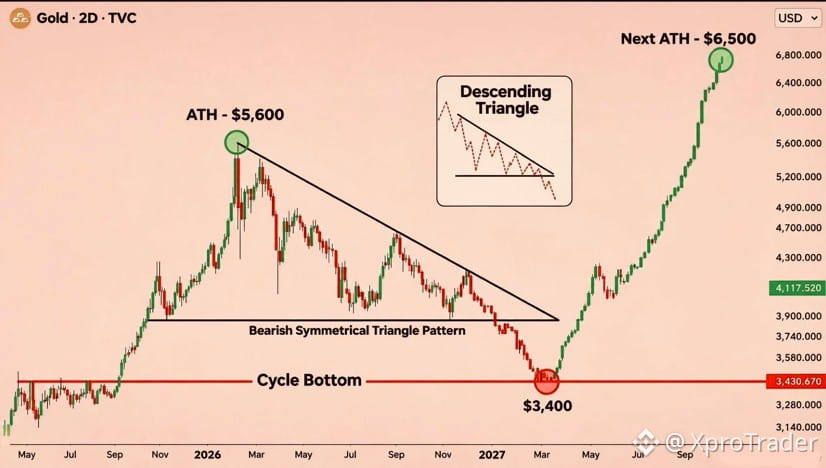
A descending triangle usually signals bearish pressure. But look what happens when price breaks support, sweeps liquidity, and reverses.
Three things to remember:
* Patterns show probabilities, not certainties.
* A breakdown can turn into a fakeout.
* Always wait for confirmation before entering.
The $3,400 area was the key level in this chart. The projected $6,500 ATH is interesting, but price still has to prove it.
$XAU
$NVDAB
$JCT
#CryptoSelloffTriggersMultipleWhaleLiquidations
#USSpotXRPETFsSeeLargestWeeklyOutflowIn8Months
A descending triangle usually signals bearish pressure. But look what happens when price breaks support, sweeps liquidity, and reverses.
Three things to remember:
* Patterns show probabilities, not certainties.
* A breakdown can turn into a fakeout.
* Always wait for confirmation before entering.
The $3,400 area was the key level in this chart. The projected $6,500 ATH is interesting, but price still has to prove it.
$XAU
$NVDAB
$JCT
#CryptoSelloffTriggersMultipleWhaleLiquidations
#USSpotXRPETFsSeeLargestWeeklyOutflowIn8Months