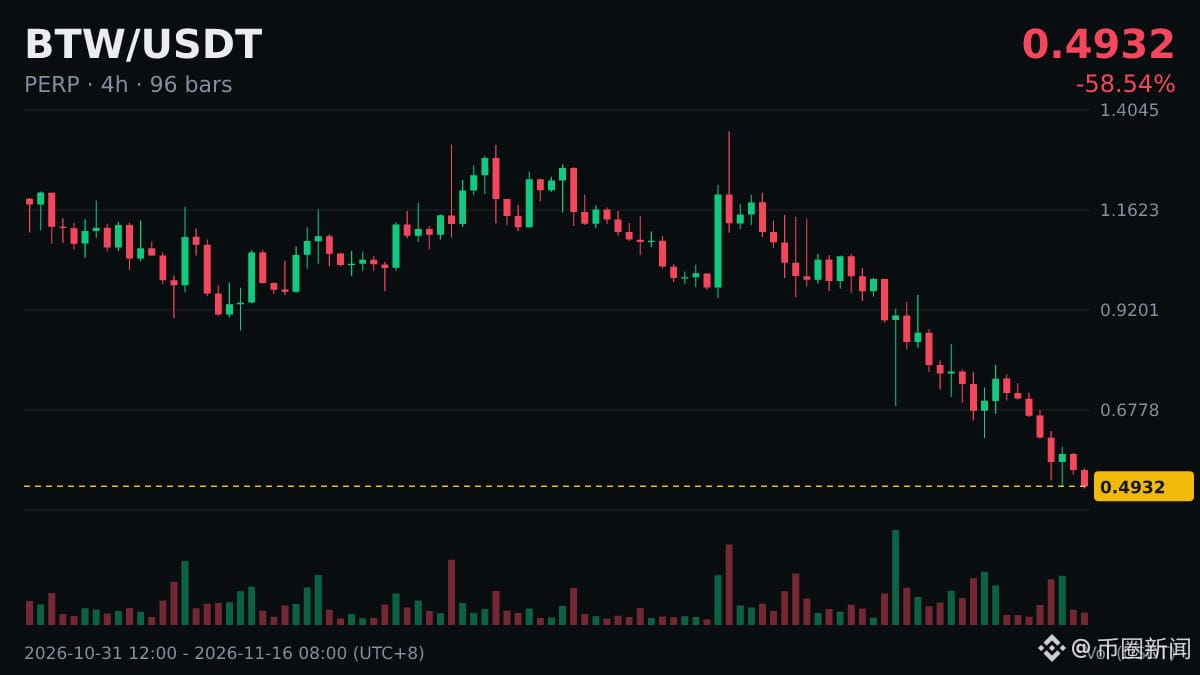
💡 RSI on the $BTW 4-hour timeframe fell to 24.8🥶
Don’t rush—understand RSI first👇
The same coin’s RSI can show quite different readings across timeframes: when it’s overbought on the 4-hour chart, it may still be in the middle range on a higher timeframe.
Many people pay more attention to the moment RSI exits the overbought or oversold zone—for example, dropping back below 70 after rising above it—rather than going against the trend as soon as it enters the zone.
Leave plenty of margin for your futures positions. Don’t let a single sharp wick wipe you out.
This view may not be right. Trade at your own risk.
Don’t rush—understand RSI first👇
The same coin’s RSI can show quite different readings across timeframes: when it’s overbought on the 4-hour chart, it may still be in the middle range on a higher timeframe.
Many people pay more attention to the moment RSI exits the overbought or oversold zone—for example, dropping back below 70 after rising above it—rather than going against the trend as soon as it enters the zone.
Leave plenty of margin for your futures positions. Don’t let a single sharp wick wipe you out.
This view may not be right. Trade at your own risk.