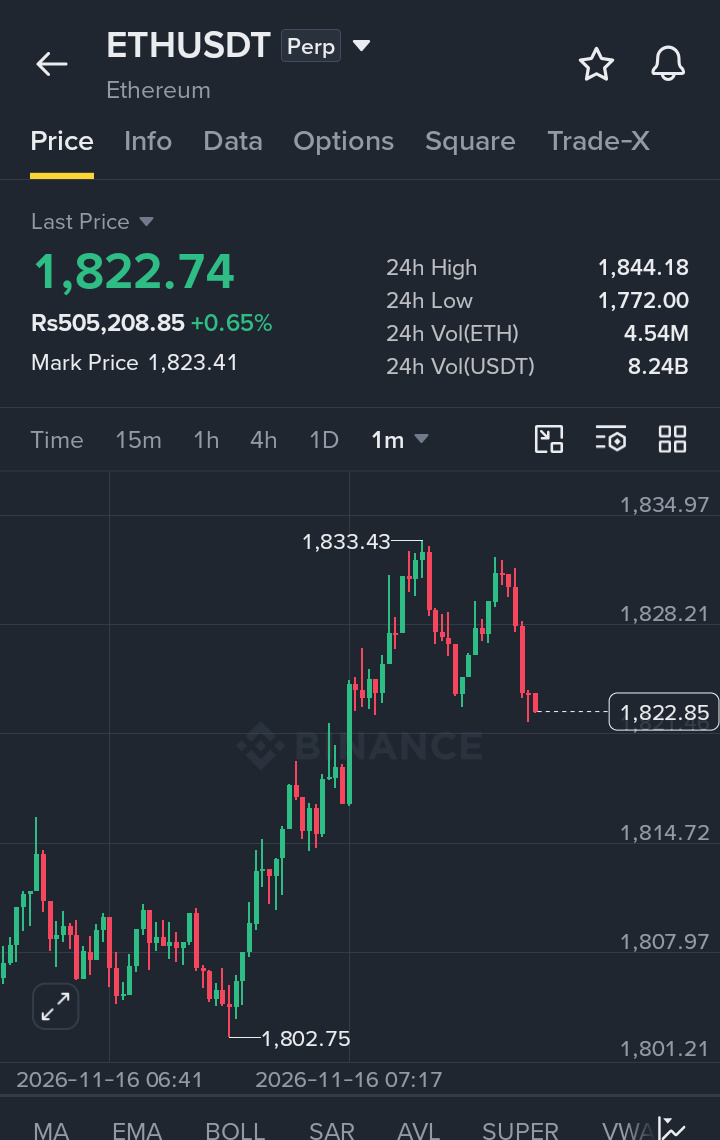

ETH is trading near 1,822.74 after rejecting the 1,833.43 local high. Price has pulled back from the 24h peak of 1,844.18 and is currently testing the 1,820–1,825 demand zone that held during the prior recovery from the 1,802.75 low.
Market Structure
Daily bias remains constructive as long as price holds above the major rising EMAs. ETH is trading above the 20/50/100 EMAs, keeping the short-to-medium term structure intact. RSI sits at 56.8 with the signal line at 52.4, reflecting neutral-to-positive momentum without overbought conditions.
EMA Structure
- 20 EMA: 1,815.30
- 50 EMA: 1,798.60
- 100 EMA: 1,782.15
- 200 EMA: 1,755.40
Price is holding firmly above the 20 EMA, which is now acting as dynamic support. The 50 and 100 EMAs form a rising cluster that continues to provide the primary medium-term support base. Immediate resistance remains the 20 EMA rejection zone overlapping with the recent local high area.
Fibonacci Levels
(Measured from the 24h swing low 1,772.00 to high 1,844.18)
- 0.0: 1,844.18
- 0.236: 1,827.15
- 0.382: 1,816.61
- 0.5: 1,808.09
- 0.618: 1,799.57
- 0.786: 1,787.45
- 1.0: 1,772.00
Current price is oscillating between the 0.236 and 0.382 retracement levels. A sustained hold above 1,816–1,820 keeps the retracement shallow and constructive.
Bullish Recovery Scenario
A reclaim and hold above 1,827–1,830 (0.236 Fib + local high) would open the path higher.
- First target: 1,833–1,844 (prior high / 0.0 Fib)
- Extension targets: 1,855 then 1,870
Bearish Continuation Scenario
Failure to hold the 1,816–1,820 zone and a break below the 50 EMA would shift control lower.
- Immediate support: 1,808 (0.5 Fib)
- Next support: 1,799–1,795 (0.618 Fib + 50 EMA cluster)
- Deeper support: 1,787 and 1,772
RSI Momentum
RSI 56.8 / Signal 52.4. Momentum remains constructive but not overbought. A move back above 60 would confirm renewed upside strength, while a drop below 45 would signal weakening recovery and increase downside risk.
Market Structure & Liquidity
The recent impulse from 1,802.75 to 1,833.43 showed clear buyer control. The current pullback is testing whether that demand remains intact. Sellers have appeared at the local highs, but no decisive breakdown has occurred yet. Liquidity rests both above 1,844 and below the 1,800 psychological area.
Key Levels
Resistance
- 1,827–1,830
- 1,833–1,844
- 1,855
Support
- 1,820–1,816
- 1,808
- 1,799–1,795
- 1,772
Final Outlook
Structure remains intact above the rising EMA cluster. The 1,816–1,820 zone is the critical decision area. Holding it keeps the path open toward a retest of 1,844 and higher. A clean break below 1,808 would open the door to deeper retracement toward 1,795–1,772.
Current Bias: Mildly bullish while above 1,816
Analysis based on the $ETH daily chart dated November 16, 2026. These levels represent technical scenarios, not guaranteed price movements.