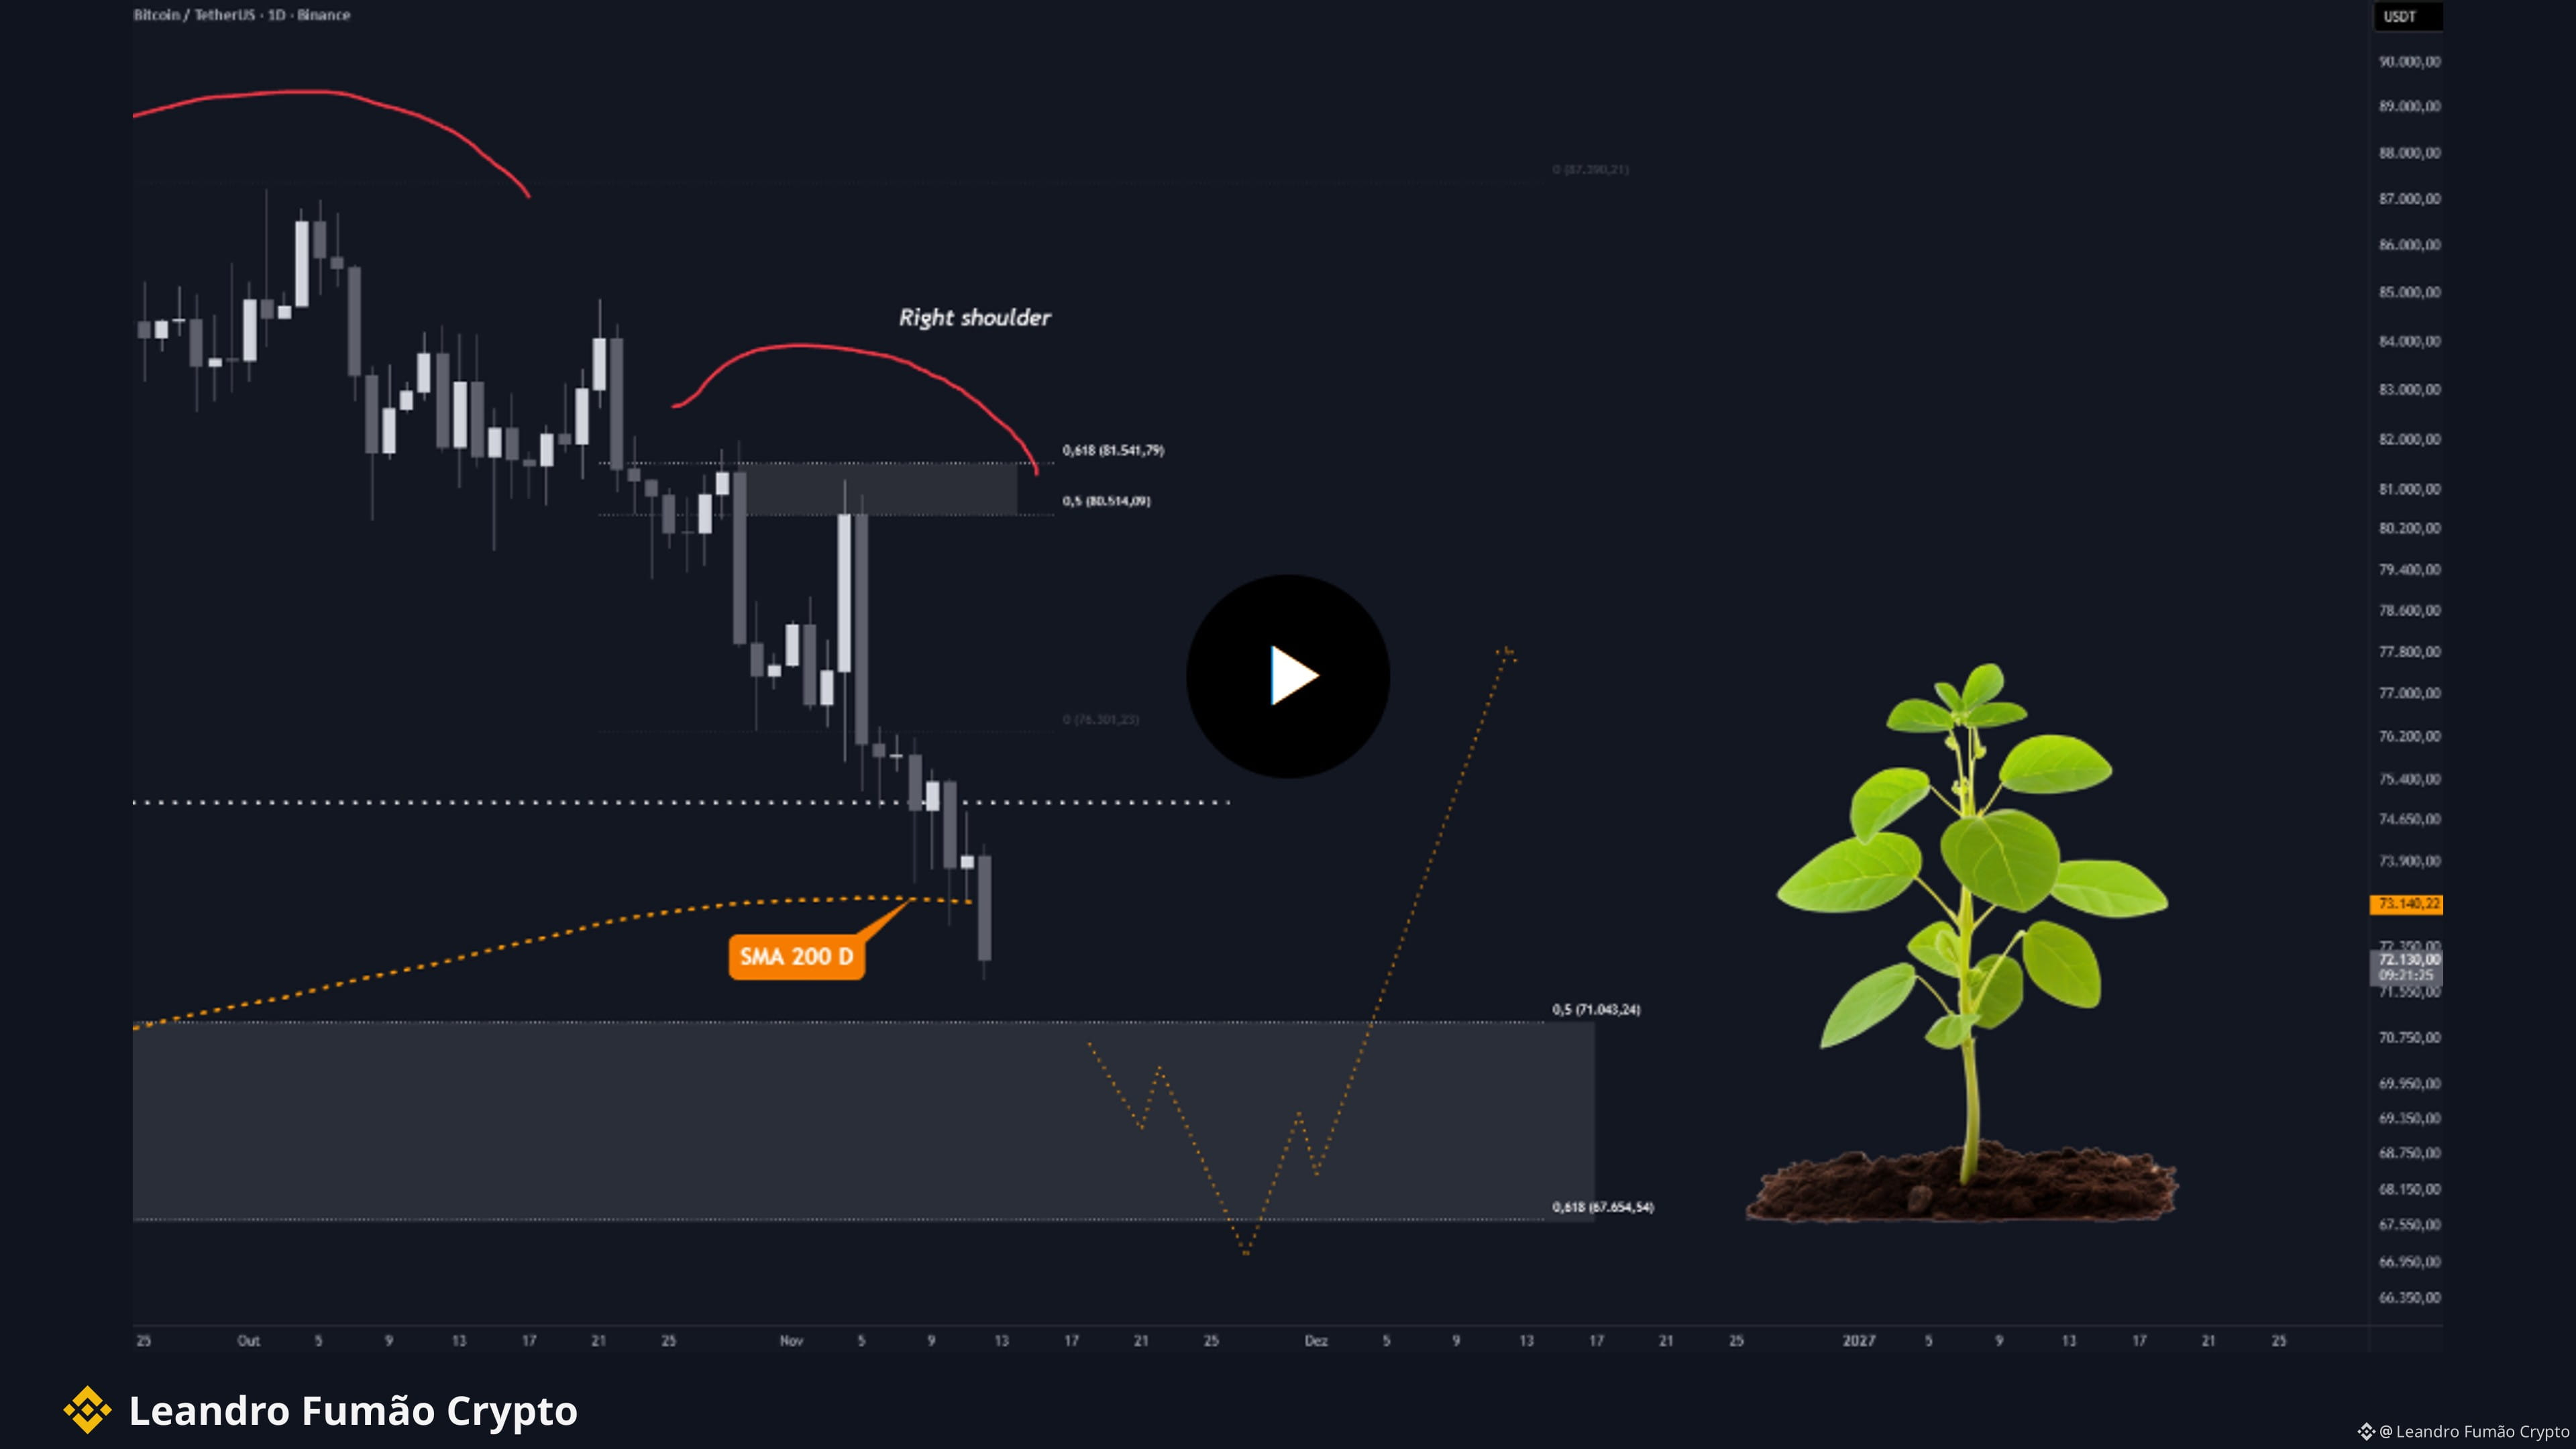
🔺♦️🔻 ₿ITCOIN AT ~US$ 65,582 ⋙ SELLING PRESSURE DOMINATES THE 45-MINUTE CHART🌿
🩸 After a significant drop from the US$76,000 area, BTC remains in a bearish structure, with successively lower highs and lows, indicating that sellers remain in control.
📉 Descending channel: The price is moving within a parallel downward channel. The upper boundary acts as dynamic resistance and the lower boundary as a possible support zone. Several recovery attempts have failed, and buying momentum remains weak, with no convincing reversal structure.
📌 Short-Term Outlook
A temporary recovery to US$66,000 ⇄ 66,500 is possible. If the price fails to break above this zone, the likelihood of further decline increases.
🎯 Downside targets:
1️⃣ US$64,600
2️⃣ US$63,900
3️⃣ US$63,000, an important support near the lower boundary of the channel if selling pressure increases.
🟢 What buyers need: To reclaim the US$66,500 area with consistent upward momentum. To signal a genuine improvement in the structure, the descending channel resistance must be broken.
💡 Overall outlook: As long as $BTC fails to reclaim the key resistance levels, the most likely scenario remains another drop toward US$64,600 and US$63,900, even if a brief upward correction occurs along the way.
⚠️ Short-term technical analysis $BTC (45-minute chart); this is not a buy or sell recommendation. Always use risk management.
📚Study Before Investing.
#bitcoin #BTC #analisetecnica
🩸 After a significant drop from the US$76,000 area, BTC remains in a bearish structure, with successively lower highs and lows, indicating that sellers remain in control.
📉 Descending channel: The price is moving within a parallel downward channel. The upper boundary acts as dynamic resistance and the lower boundary as a possible support zone. Several recovery attempts have failed, and buying momentum remains weak, with no convincing reversal structure.
📌 Short-Term Outlook
A temporary recovery to US$66,000 ⇄ 66,500 is possible. If the price fails to break above this zone, the likelihood of further decline increases.
🎯 Downside targets:
1️⃣ US$64,600
2️⃣ US$63,900
3️⃣ US$63,000, an important support near the lower boundary of the channel if selling pressure increases.
🟢 What buyers need: To reclaim the US$66,500 area with consistent upward momentum. To signal a genuine improvement in the structure, the descending channel resistance must be broken.
💡 Overall outlook: As long as $BTC fails to reclaim the key resistance levels, the most likely scenario remains another drop toward US$64,600 and US$63,900, even if a brief upward correction occurs along the way.
⚠️ Short-term technical analysis $BTC (45-minute chart); this is not a buy or sell recommendation. Always use risk management.
📚Study Before Investing.
#bitcoin #BTC #analisetecnica