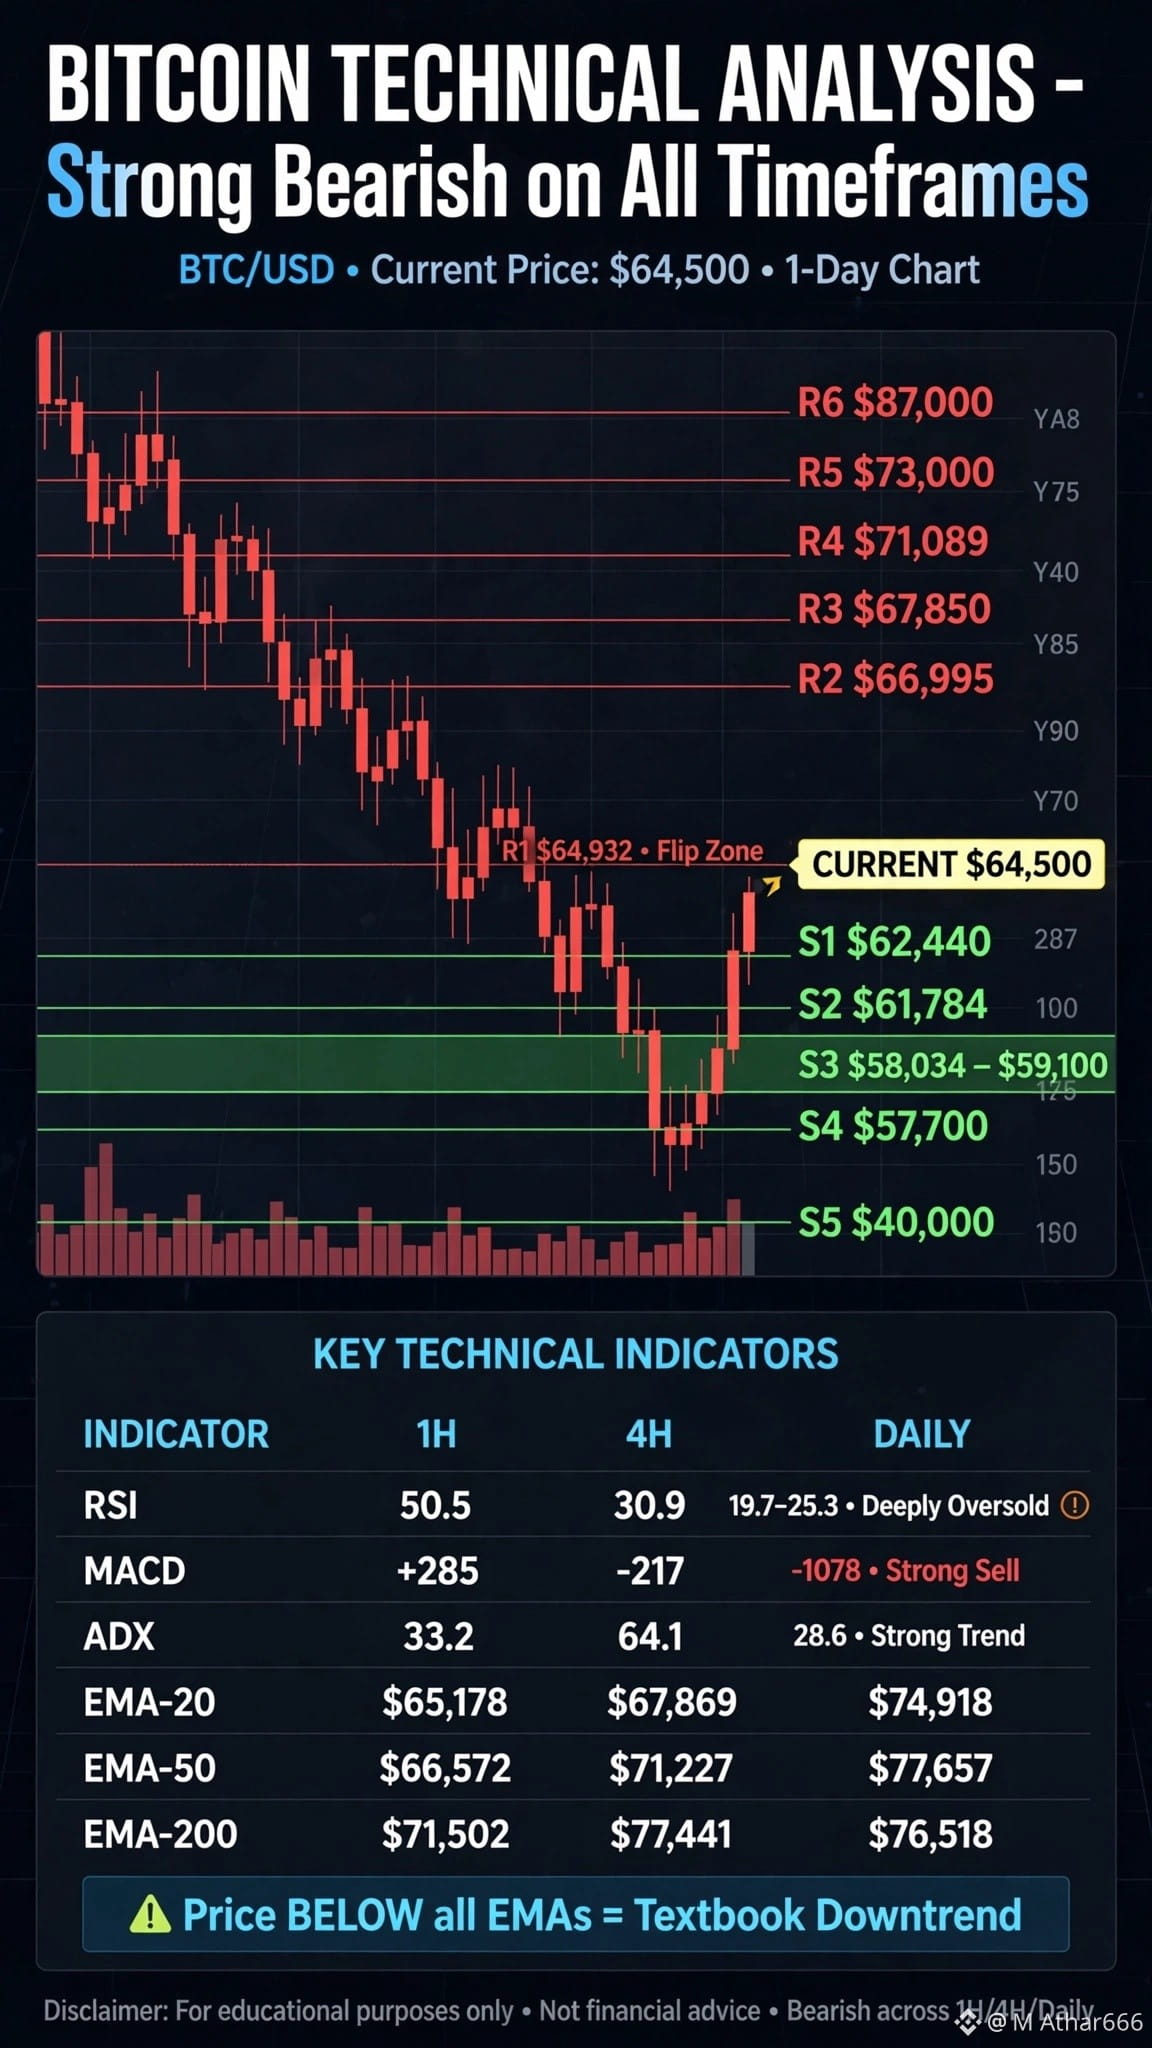
$BTC TECHNICAL ANALYSIS - FULL BREAKDOWN
*Trend: Strong Bearish on ALL timeframes*
Indicator 1H 4H Daily
RSI (14) 50.5 30.9 **19.7 - 25.3**
MACD +285 -217 **-1,078**
ADX 33.2 64.1 28.6
EMA-20 \$65,178 \$67,869 \$74,918
EMA-50 \$66,572 \$71,227 \$77,657
EMA-200 \$71,502 \$77,441 \$76,518
*What this means:*
- Price is BELOW all EMAs. That is textbook downtrend.
- Daily RSI 19.7 is *deeply oversold*. Last time RSI was this low was March 2020 crash and Nov 2022 FTX crash. Oversold does NOT mean buy immediately - it can stay oversold for weeks.
- ADX 64 on 4H = Trend is VERY strong to downside.
- MACD is deeply negative, no bullish crossover yet.
*Support & Resistance:*
*Supports (Where buyers may step in):*
- *S1: $62,440* - Nearest, tested today, held for now
- *S2: $61,784* - Major, if breaks, panic starts
- *S3: $58,034 - $59,100* - Strong demand zone
- *S4: $57,700* - 2026 low / Invalidation for bulls
- *S5: $40,000* - Worst case if 200-week MA fails (Benjamin Cowen warning)
*Resistances (Where sellers will sell):*
- *R1: $64,932* - Flip Zone, price is fighting here right now
- *R2: $66,995* - Major resistance
- *R3: $67,850* - Must reclaim for any recovery
- *R4: $71,089* - Next
- *R5: $73,000* - Bullish confirmation level
- *R6: $87,000* - Full trend reversal
#WillFOMCMinutesReinforceRateHikeExpectations? #About64000BitcoinMiningMachinesReportedlyHijacked #HuangReportedlyConsidersReturnToNvidia
*Trend: Strong Bearish on ALL timeframes*
Indicator 1H 4H Daily
RSI (14) 50.5 30.9 **19.7 - 25.3**
MACD +285 -217 **-1,078**
ADX 33.2 64.1 28.6
EMA-20 \$65,178 \$67,869 \$74,918
EMA-50 \$66,572 \$71,227 \$77,657
EMA-200 \$71,502 \$77,441 \$76,518
*What this means:*
- Price is BELOW all EMAs. That is textbook downtrend.
- Daily RSI 19.7 is *deeply oversold*. Last time RSI was this low was March 2020 crash and Nov 2022 FTX crash. Oversold does NOT mean buy immediately - it can stay oversold for weeks.
- ADX 64 on 4H = Trend is VERY strong to downside.
- MACD is deeply negative, no bullish crossover yet.
*Support & Resistance:*
*Supports (Where buyers may step in):*
- *S1: $62,440* - Nearest, tested today, held for now
- *S2: $61,784* - Major, if breaks, panic starts
- *S3: $58,034 - $59,100* - Strong demand zone
- *S4: $57,700* - 2026 low / Invalidation for bulls
- *S5: $40,000* - Worst case if 200-week MA fails (Benjamin Cowen warning)
*Resistances (Where sellers will sell):*
- *R1: $64,932* - Flip Zone, price is fighting here right now
- *R2: $66,995* - Major resistance
- *R3: $67,850* - Must reclaim for any recovery
- *R4: $71,089* - Next
- *R5: $73,000* - Bullish confirmation level
- *R6: $87,000* - Full trend reversal
#WillFOMCMinutesReinforceRateHikeExpectations? #About64000BitcoinMiningMachinesReportedlyHijacked #HuangReportedlyConsidersReturnToNvidia