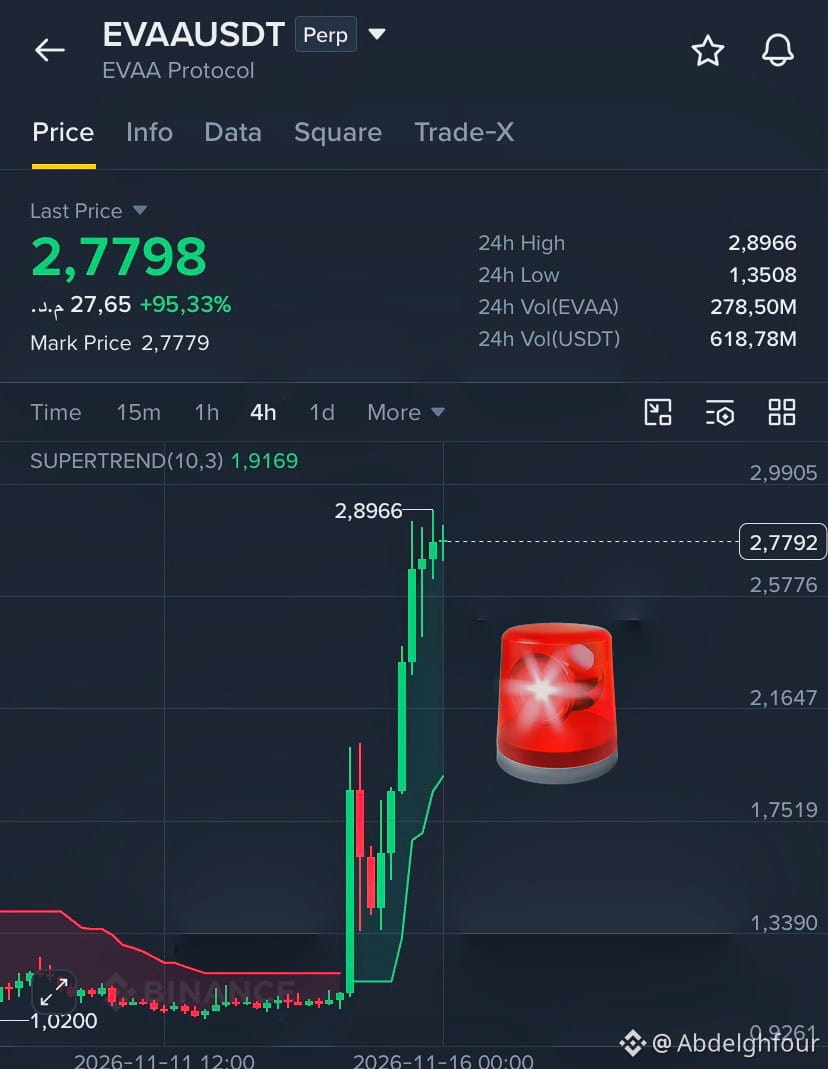
📉 Technical Warning $EVAA : Why Is the Current Price (2.75) a Trap for Buyers?
After a rise of over 180%, technical data is showing clear signs that a sharp correction may be approaching.
My Take and Analysis (Your Take):
We are in a dangerous "overbought" zone. The 4-hour RSI reached 85 (a historically alarming level), and the 4-hour candles show long upper wicks, confirming strong selling pressure at the top. More importantly, the funding rate is positive and elevated (0.0823%), meaning the market is crowded with long positions, making it vulnerable to a "long squeeze" and a sudden crash. Whales have also started reducing their long positions and opening short positions.
My Trade Setup:
Don't chase the price! The current price is in a dangerous area to chase:
🎯 Option One (Safer — Wait for a Correction):
Entry: 2.2000 - 2.3000 (major liquidity zone).
Stop loss: 1.9500
Target: 2.6000, then 2.8500
⚠️ Option Two (For Professionals — Short Selling):
Entry: 2.7500 - 2.8000
Stop loss: 2.9200 (above the peak).
Target: 2.4000, then 2.1500
The liquidity map shows a strong magnet at 2.0 - 2.3, and the price is likely to move toward it.
My question for you: Will the price of $EVAA break above the 2.89 peak first and liquidate short positions, or will we see a direct crash toward 2.30? Share your predictions. 👇
Disclaimer: This is technical analysis, not financial advice. Leveraged trading involves high risks.
After a rise of over 180%, technical data is showing clear signs that a sharp correction may be approaching.
My Take and Analysis (Your Take):
We are in a dangerous "overbought" zone. The 4-hour RSI reached 85 (a historically alarming level), and the 4-hour candles show long upper wicks, confirming strong selling pressure at the top. More importantly, the funding rate is positive and elevated (0.0823%), meaning the market is crowded with long positions, making it vulnerable to a "long squeeze" and a sudden crash. Whales have also started reducing their long positions and opening short positions.
My Trade Setup:
Don't chase the price! The current price is in a dangerous area to chase:
🎯 Option One (Safer — Wait for a Correction):
Entry: 2.2000 - 2.3000 (major liquidity zone).
Stop loss: 1.9500
Target: 2.6000, then 2.8500
⚠️ Option Two (For Professionals — Short Selling):
Entry: 2.7500 - 2.8000
Stop loss: 2.9200 (above the peak).
Target: 2.4000, then 2.1500
The liquidity map shows a strong magnet at 2.0 - 2.3, and the price is likely to move toward it.
My question for you: Will the price of $EVAA break above the 2.89 peak first and liquidate short positions, or will we see a direct crash toward 2.30? Share your predictions. 👇
Disclaimer: This is technical analysis, not financial advice. Leveraged trading involves high risks.