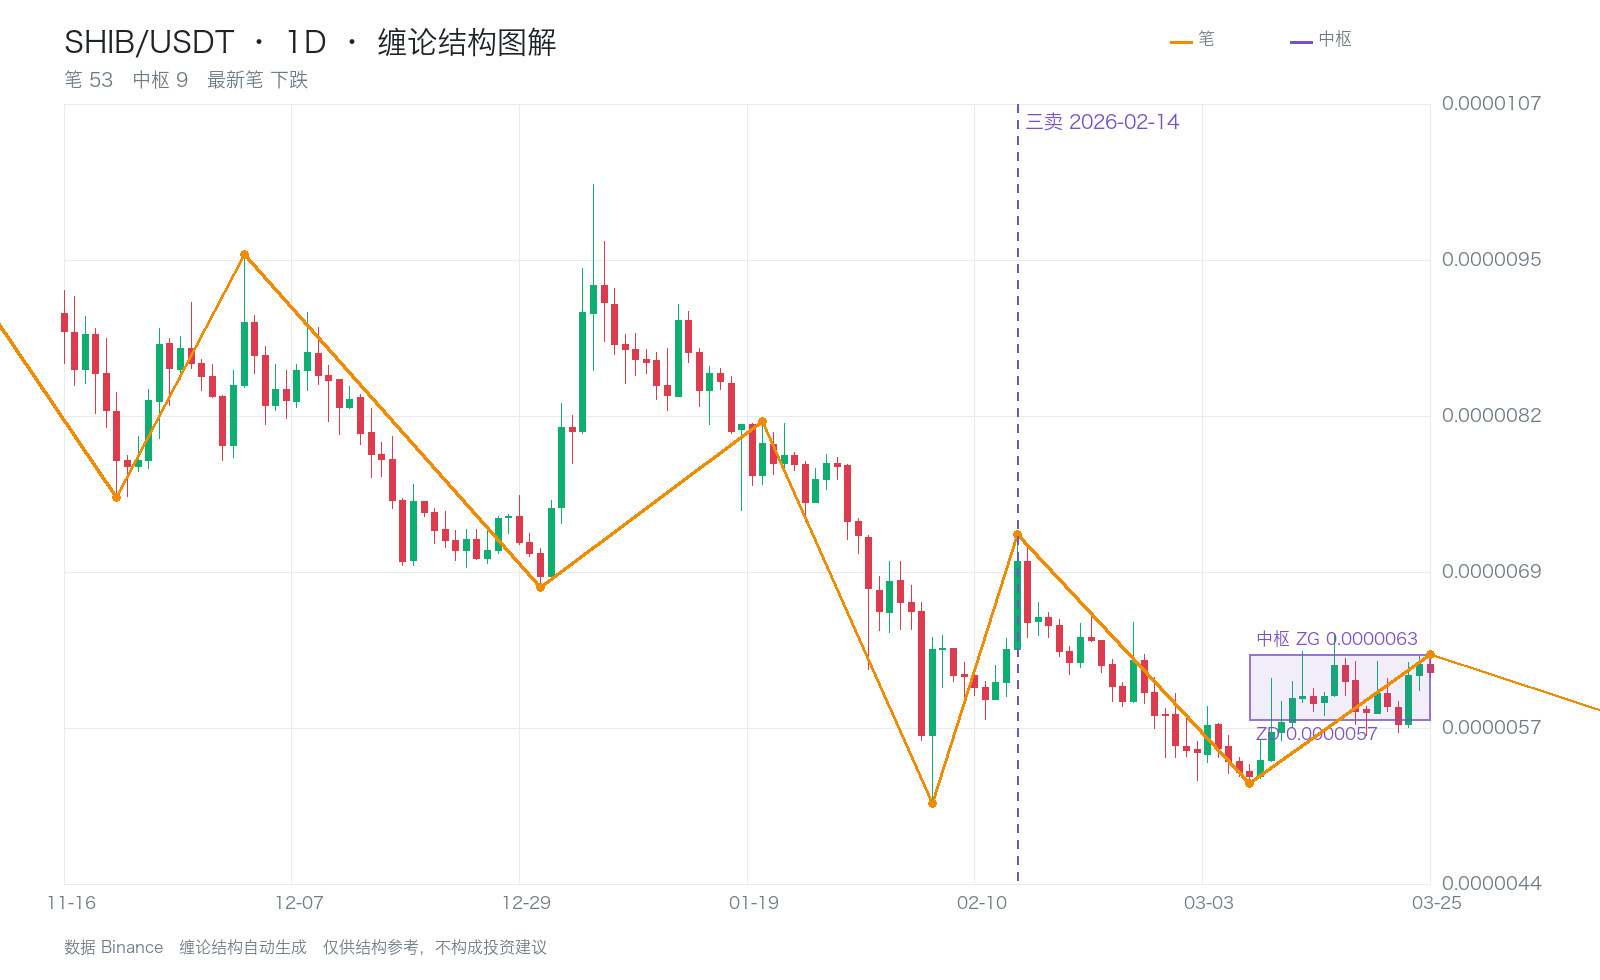
Let’s review a historical case: On February 14, 2026, SHIB showed a third sell signal on the 1d timeframe.
At the time, the consolidation range was 0.0000092–0.0000095. The signal price of 0.0000073 was below the lower boundary of 0.0000092, making it a rebound sell point after the price broke below the range.
After the signal appeared, the price fell to a low of 0.0000053 within 20 candlesticks, a maximum drop of 27.4% from the signal price (closing at 0.0000054).
That’s the value of a third sell: the position is determined by the consolidation range, and the stop-loss is placed near its upper boundary—small losses, big gains.
History doesn’t repeat itself exactly, but patterns recur. It takes seeing the same setup many times before you dare to act on a genuine signal.
$SHIB $BTC $ETH #缠论 #Whale Accumulation
At the time, the consolidation range was 0.0000092–0.0000095. The signal price of 0.0000073 was below the lower boundary of 0.0000092, making it a rebound sell point after the price broke below the range.
After the signal appeared, the price fell to a low of 0.0000053 within 20 candlesticks, a maximum drop of 27.4% from the signal price (closing at 0.0000054).
That’s the value of a third sell: the position is determined by the consolidation range, and the stop-loss is placed near its upper boundary—small losses, big gains.
History doesn’t repeat itself exactly, but patterns recur. It takes seeing the same setup many times before you dare to act on a genuine signal.
$SHIB $BTC $ETH #缠论 #Whale Accumulation