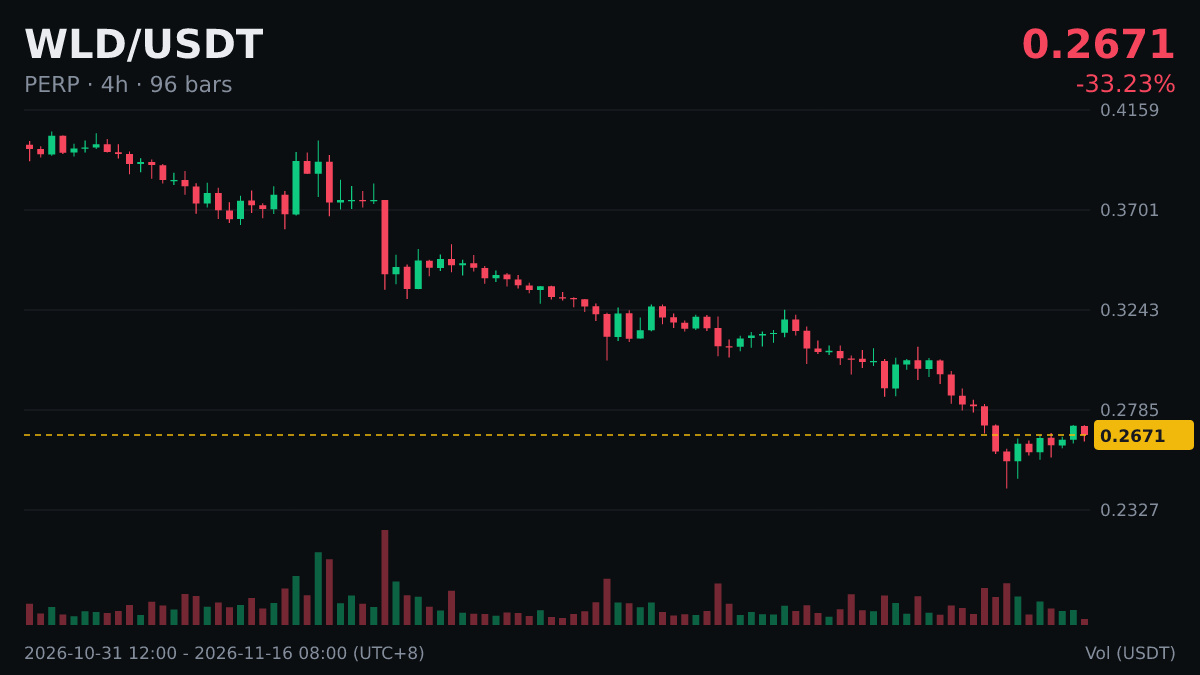
$WLD 4 hours: MACD formed a bullish crossover below the zero line, after 11 consecutive bars moving in the opposite direction before the crossover.
Let’s use this data to talk about MACD.
The length of the bars represents the distance between DIF and DEA. Bars growing longer one by one indicate that momentum in the current direction is increasing; bars getting shorter indicate it is weakening.
Many people watch for bearish and bullish divergences: when the price makes a new high but MACD doesn’t, or the price makes a new low but MACD doesn’t, these are often seen as signs of weakening momentum.
Calculating position size based on where you place your stop-loss is much more reliable than placing trades on gut feeling.
This is not investment advice. Don’t copy it blindly.
Let’s use this data to talk about MACD.
The length of the bars represents the distance between DIF and DEA. Bars growing longer one by one indicate that momentum in the current direction is increasing; bars getting shorter indicate it is weakening.
Many people watch for bearish and bullish divergences: when the price makes a new high but MACD doesn’t, or the price makes a new low but MACD doesn’t, these are often seen as signs of weakening momentum.
Calculating position size based on where you place your stop-loss is much more reliable than placing trades on gut feeling.
This is not investment advice. Don’t copy it blindly.