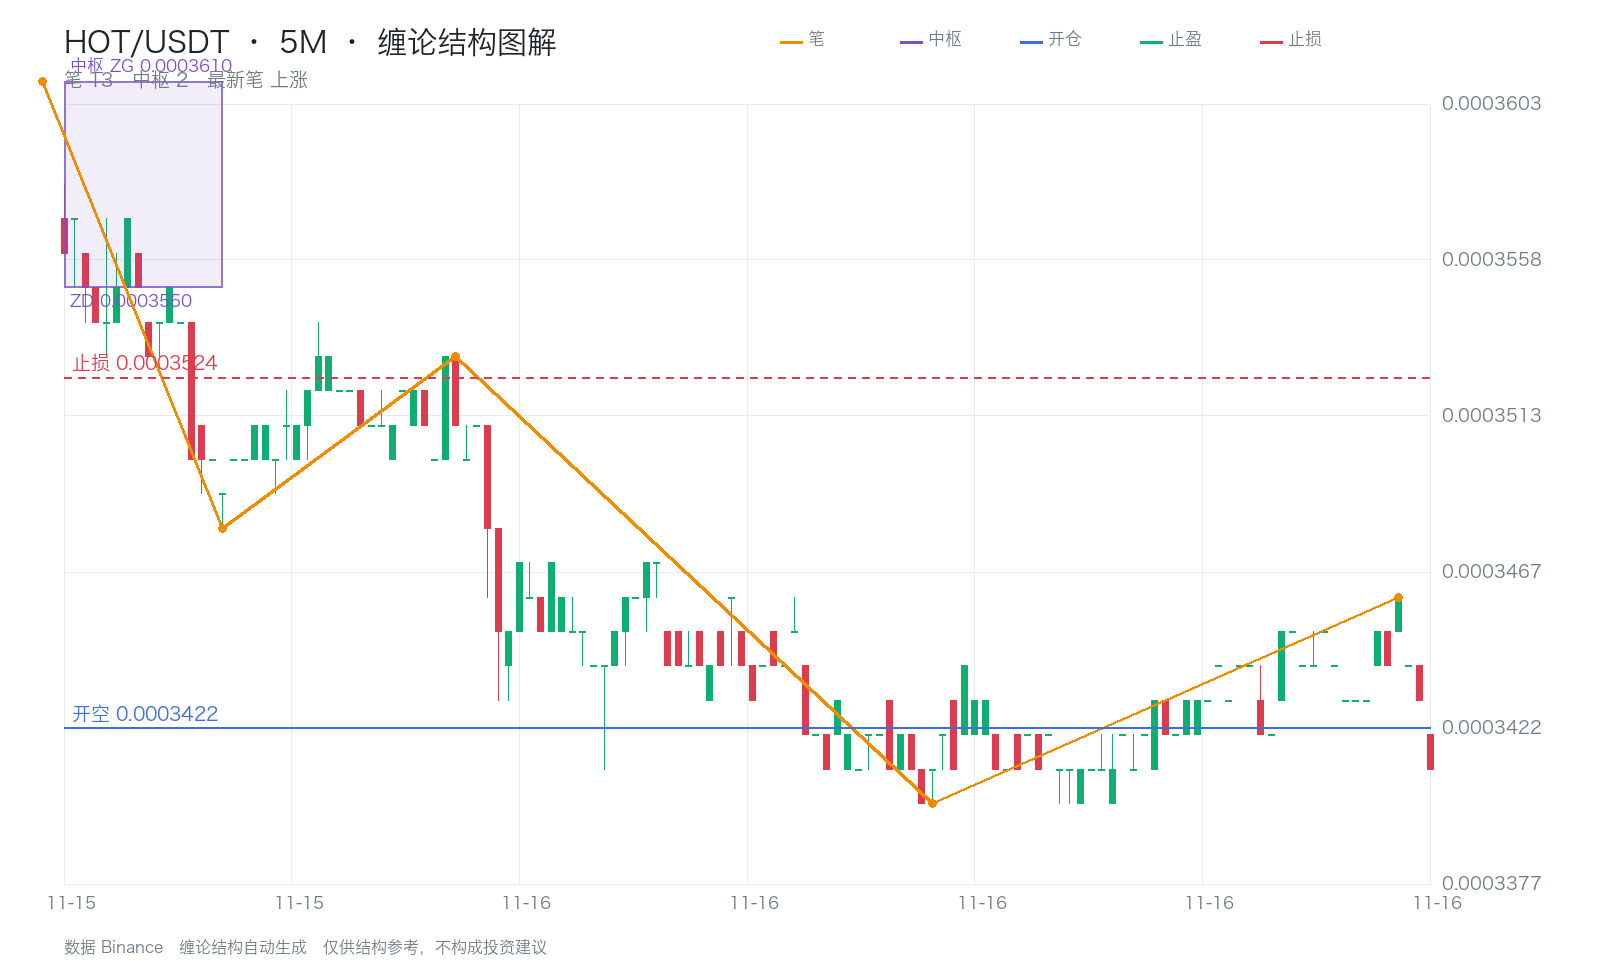
HOT 5-minute chart shows a 3-sell signal; short entry at 0.0003422.
The central pivot zone it just left was 0.0003550–0.0003610. After breaking below it, the price has not returned to the zone.
According to Chan theory, when the first rebound after a break below the central pivot zone fails to re-enter it, that is a 3-sell signal—the textbook short-entry point.
Looking at the two higher timeframes, both the 4-hour and daily charts are below their respective central pivot zones. The broader trend is aligned to the downside, confirming the 3-sell signal.
Stop-loss: 0.0003524 (about 3.0% to exit); take-profit: 0.0003216. Limited downside, amplified upside.
$HOT $BTC $ETH #缠论 #StablecoinShrinkage
The central pivot zone it just left was 0.0003550–0.0003610. After breaking below it, the price has not returned to the zone.
According to Chan theory, when the first rebound after a break below the central pivot zone fails to re-enter it, that is a 3-sell signal—the textbook short-entry point.
Looking at the two higher timeframes, both the 4-hour and daily charts are below their respective central pivot zones. The broader trend is aligned to the downside, confirming the 3-sell signal.
Stop-loss: 0.0003524 (about 3.0% to exit); take-profit: 0.0003216. Limited downside, amplified upside.
$HOT $BTC $ETH #缠论 #StablecoinShrinkage