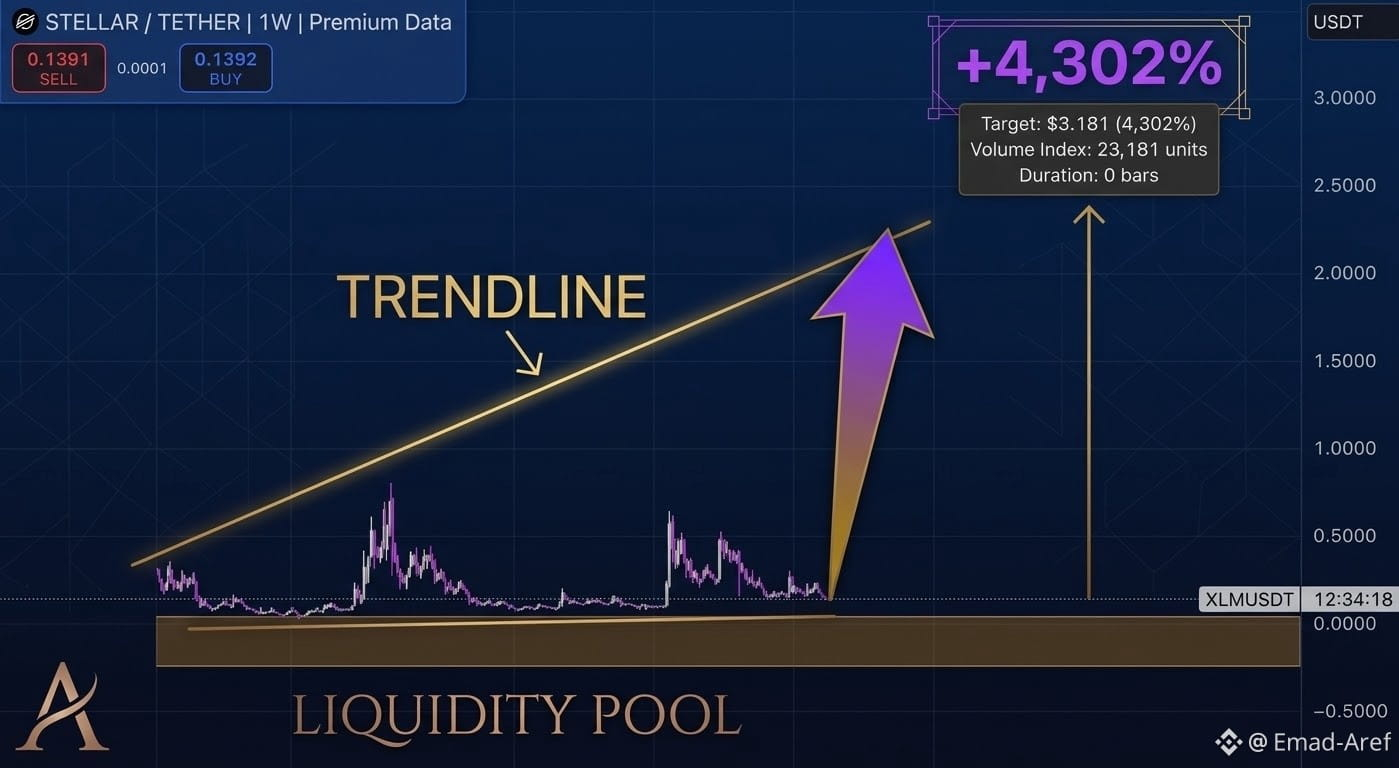
A look at the $XLM weekly chart near 0.139: Is history repeating itself? 📊⚡
When observing Stellar's historical price action since 2018, we notice a recurring pattern of explosive rallies followed by lengthy corrections, with the price returning to test the same pivotal liquidity zone once again.
Key roadmap milestones:
- $0.20: First resistance and initial reclaim test.
- $0.35: Main breakout target, supported by trading volume.
- $0.63–$0.80: The most significant historical resistance zone.
- $1.00 and above: Psychological milestones, extending to the maximum levels of an extreme bullish scenario.
Trading perspective: Talk of exceptional gains remains speculative and far from guaranteed. The risk of a pullback remains unless buyers defend the current historical liquidity zone. Patience and risk management are key.
In your opinion, will $XLM respect the historical liquidity zones and pave the way for a new bullish cycle? Share your thoughts in the comments 👇
$XLM
When observing Stellar's historical price action since 2018, we notice a recurring pattern of explosive rallies followed by lengthy corrections, with the price returning to test the same pivotal liquidity zone once again.
Key roadmap milestones:
- $0.20: First resistance and initial reclaim test.
- $0.35: Main breakout target, supported by trading volume.
- $0.63–$0.80: The most significant historical resistance zone.
- $1.00 and above: Psychological milestones, extending to the maximum levels of an extreme bullish scenario.
Trading perspective: Talk of exceptional gains remains speculative and far from guaranteed. The risk of a pullback remains unless buyers defend the current historical liquidity zone. Patience and risk management are key.
In your opinion, will $XLM respect the historical liquidity zones and pave the way for a new bullish cycle? Share your thoughts in the comments 👇
$XLM