$MEGA 🚀 Keep an eye on the MEGA/USDT chart!
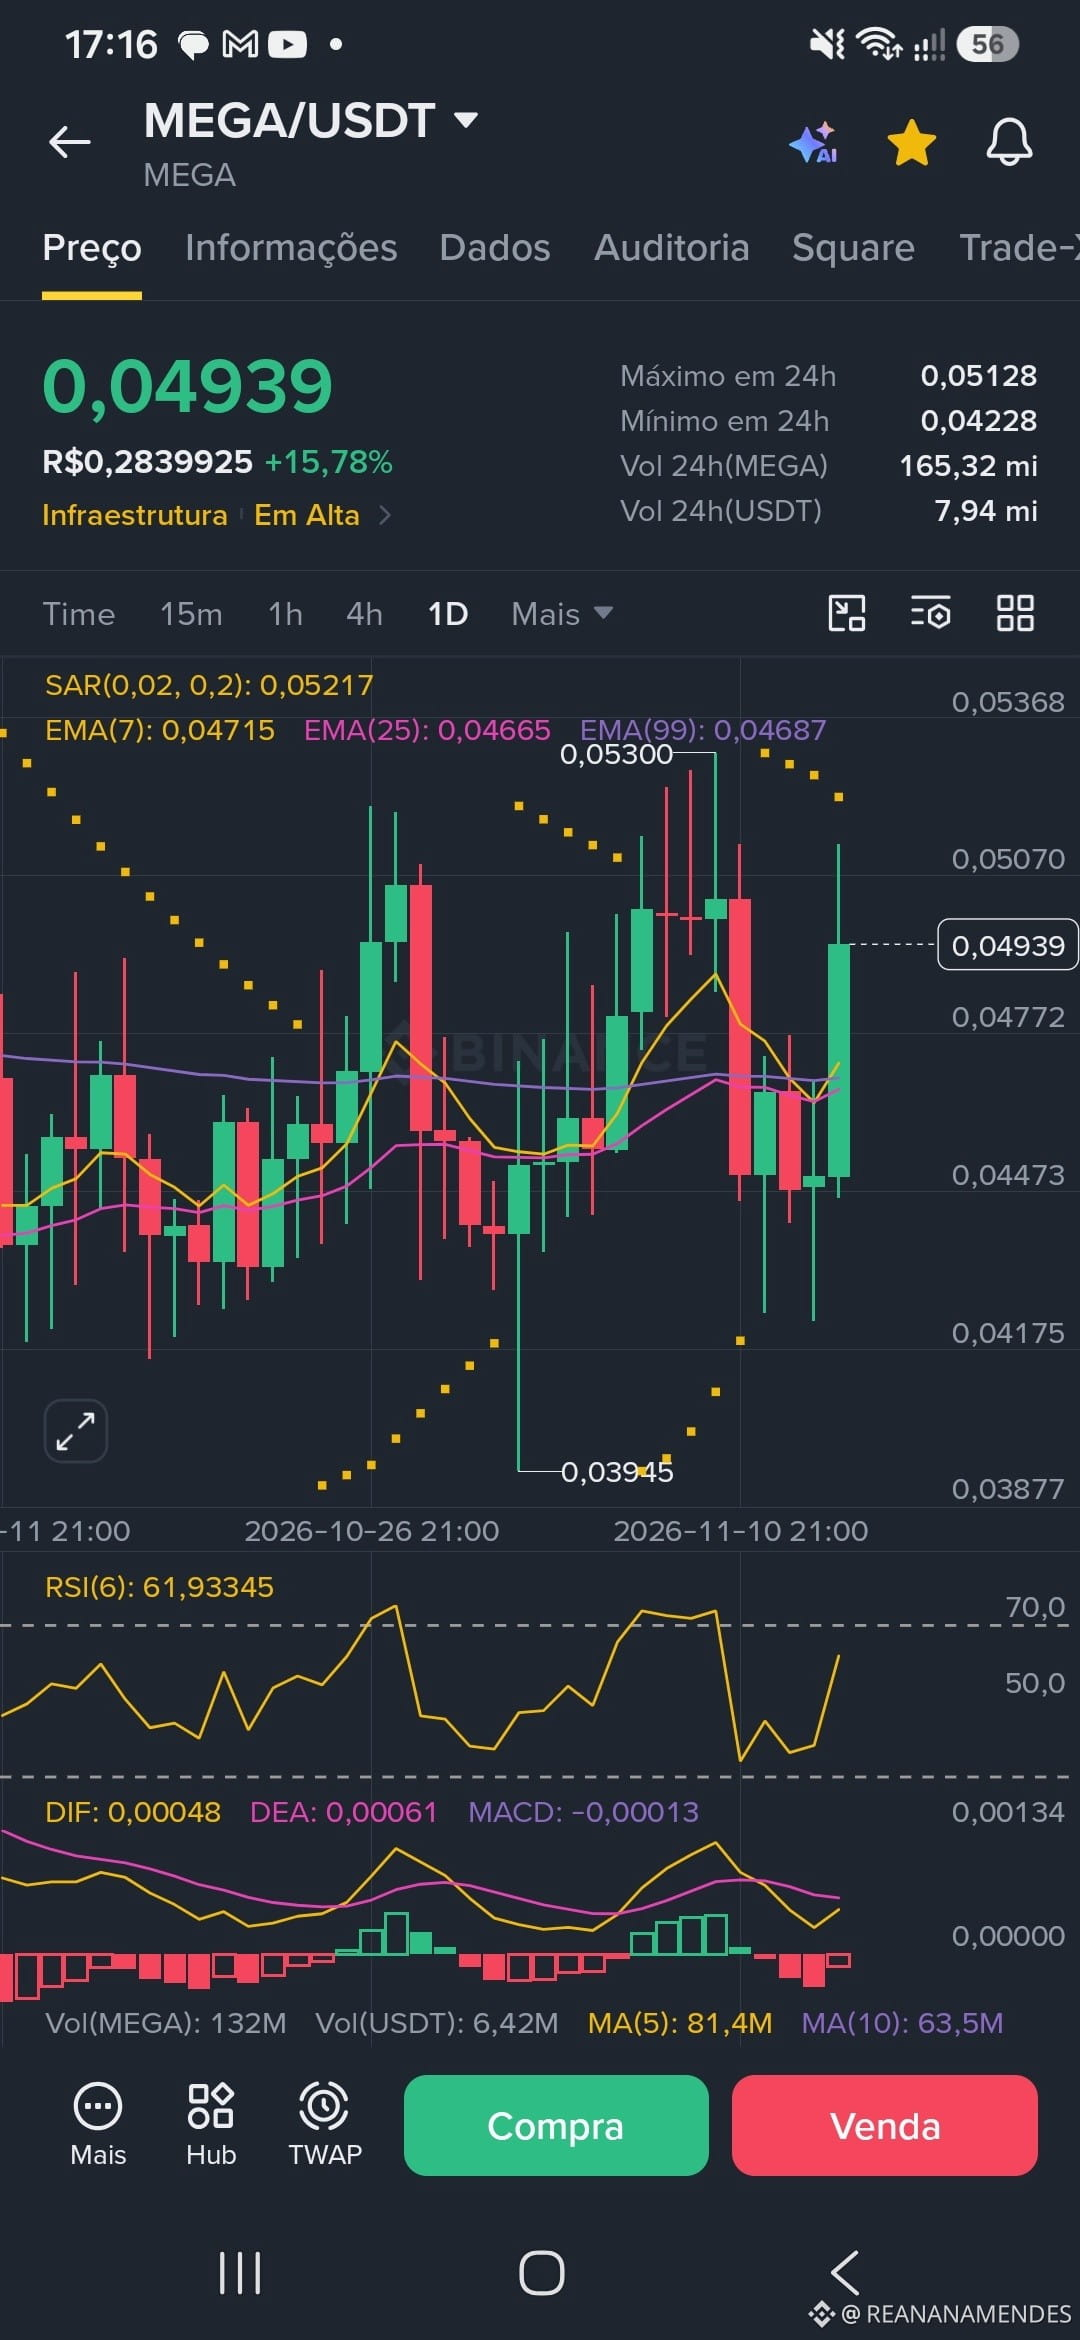
The asset is showing an interesting recovery on the daily chart (1D), up +15.78% and trading at 0.04939 USDT (approximately R$ 0.28).
Taking a look at the current technical indicators:
Moving Averages (EMA): The EMA(7) at 0.04715 is crossing above the reference lines, indicating a bullish short-term trend.
RSI (6): Around 61.93, showing buyer strength in the market, but still far from an extreme overbought zone.
Volume: Strong activity over the past 24 hours, with notably high trading volume.
Will MEGA try to test the 0.05300 resistance again in the coming days?
$MEGA
The asset is showing an interesting recovery on the daily chart (1D), up +15.78% and trading at 0.04939 USDT (approximately R$ 0.28).
Taking a look at the current technical indicators:
Moving Averages (EMA): The EMA(7) at 0.04715 is crossing above the reference lines, indicating a bullish short-term trend.
RSI (6): Around 61.93, showing buyer strength in the market, but still far from an extreme overbought zone.
Volume: Strong activity over the past 24 hours, with notably high trading volume.
Will MEGA try to test the 0.05300 resistance again in the coming days?
$MEGA